Topics 2016.08.06
Seismic anisotropy tomography and subduction dynamics beneath Japan
We are studying the subduction dynamics beneath Japan through investigation of seismic velocity azimuthal anisotropy using a large amount of P- and S-wave travel time data. Our Global Earthquake & Volcano Research Group at the Research Center for Prediction of Earthquakes and Volcanic Eruptions (RCPEVE) has been investigating the Earth's interior structure using a method called seismic tomography. The generation of earthquakes and volcanic eruptions is a consequence of geodynamics and structural heterogeneity in the Earth, so it is important to obtain detailed images of the Earth structure so as to better understand these phenomena. So far, observations of seismic waves have revealed spatial dependence of their travel times even when the epicentral distances are the same. The variations in the travel times enable us to reveal seismic velocity heterogeneities in the Earth, i.e., the distribution of faster or slower wave-speeds as compared with the averaged Earth structure. Therefore, seismic tomography, an inversion technique using a large amount of P- and S-wave travel time data, provides us with high-resolution 3-D images of the Earth's structure. Its principle is the same as that of the medical X-ray CT (computerized tomography) scan.
Using a huge amount of P- and S-wave travel time data, we can further reveal directional dependence of seismic velocity, which is called seismic anisotropy. Seismic anisotropy is considered as a first-order effect which is caused by selective alignment of minerals due to mantle flow, or the initial status of plate consolidation at the oceanic ridges. Therefore, seismic anisotropy tomography can provide not only snapshots of the Earth structure but also information on geodynamic processes, hence it represents a frontier of solid-Earth geophysics (Zhao et al., 2016).
Recently we have obtained high-resolution 3-D images of azimuthal anisotropy of the Japan subduction zone down to a depth of 700 km (Liu and Zhao, 2016). The Japan Islands are located in a region where four lithospheric plates are strongly interacting with each other. The old Pacific plate is subducting beneath NE Japan which belongs to the Okhotsk plate, whereas the young Philippine Sea (PHS) plate is subducting beneath SW Japan which belongs to the Eurasian plate (Figure 1). We have used over one million P- and S-wave travel-time data of 2528 local earthquakes and 1390 teleseismic events recorded by 1852 seismic stations which cover the Japan Islands densely and uniformly.
Our main findings are summarized as follows.
1. Significant trench-normal fast-velocity directions (FVDs) exist in the mantle wedge, which reflects corner flow in the mantle wedge due to the active subduction and dehydration of the oceanic plates (Figure 2a).
2. The subducting Pacific and PHS slabs mainly exhibit trench-parallel FVDs, which may reflect frozen-in lattice-preferred orientation of aligned anisotropic minerals formed at the mid-ocean ridge as well as shape-preferred orientation such as normal faults produced at the outer-rise area near the trench axis (Figure 2b).
3. Significant low-velocity anomalies with trench-normal FVDs exist in the mantle under the Pacific slab beneath NE Japan, which may reflect a subducting oceanic asthenosphere affected by hot mantle upwelling from the deeper mantle (Figure 2c).
References:
Liu, X., D. Zhao (2016) Seismic velocity azimuthal anisotropy of the Japan subduction zone: Constraints from P and S wave traveltimes. J. Geophys. Res. 121, doi:10.1002/2016JB013116.
Zhao, D., S. Yu, X. Liu (2016) Seismic anisotropy tomography: New insight into subduction dynamics. Gondwana Res. 33, 24-43.
(This article was written by Prof. Dapeng Zhao and Assist. Prof. Genti Toyokuni of the Global Earthquake & Volcano Research Group, Research Center for Prediction of Earthquakes and Volcanic Eruptions, Tohoku University).
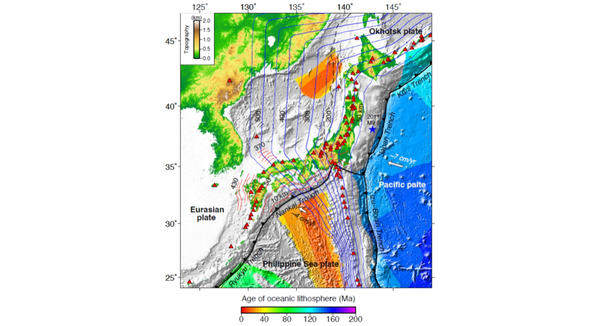
Figure 1. Tectonic settings of the study region. The red triangles denote the active and Quaternary volcanoes. The solid sawtooth lines and the black dashed line denote the plate boundaries. The blue and red lines denote the depth contours of the upper boundaries of the subducting Pacific and Philippine Sea slabs.
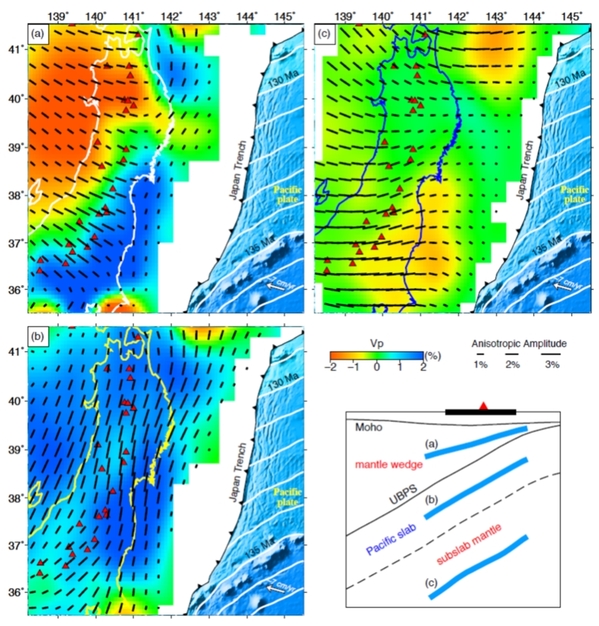
Figure 2. Map views of P-wave azimuthal anisotropy tomography along three slices in (a) the middle mantle wedge, (b) the subducting Pacific slab, and (c) the subslab mantle beneath NE Japan as shown in the sketch beside Figure 2b. The red and blue colors denote low and high isotropic velocities, respectively. The orientation and length of the short black bars represent the fast-velocity direction (FVD) and the anisotropic amplitude, respectively. The scales for the isotropic velocity perturbation (in %) and the anisotropic amplitude are shown below Figure 2c.