Topics 2018.04.06
The beautiful story between the ocean and atmosphere

Figure 1 A photo in the North Pacific.
Have you ever boarded a ship? Have you ever been far away from land and experienced the open ocean? You can take in the beautiful scenes of the ocean and atmosphere for an entire 360 degrees (Fig. 1). Both the ocean and atmosphere that seem to exist quietly, exchanging heat with each other through the sea surface. This heat exchange process has existed since the birth of oceans over 40 billion years ago. Through modern climate science, it is becoming clear that the heat exchange between the ocean and atmosphere greatly influences the global climate. Let me give you a glimpse into the wonderful world between the ocean and atmosphere with the heat exchange as the focal point.
Numerous climate scientists have undertaken the challenge to reveal the heat exchange processes between the ocean and atmosphere. They suggested that the atmosphere drives the heat exchange in mid- and high-latitude regions, such as where we live in Japan. That is, in mid- and high-latitude oceans, strong winds on the sea surface enhance heat release from the ocean, resulting in a cooling of the waters. Put simply, this is the same mechanism as "blowing on hot tea to cool it". But recently, an increase of available ocean and atmosphere datasets (e.g., satellite-derived data with high spatial and temporal resolutions) has provided us with a new perspective of the ocean-atmosphere relationship. I will elaborate a new viewpoint/process/assessment of the ocean and atmosphere off the east coast of Japan, close to Tohoku University.
Observe the left panel of Fig. 2. This figure displays a sea surface current field in January 1, 2002. There is a strong eastward current around 35-37°N. This current is the Kuroshio Extension, which is one of the strongest warm currents in the world's oceans. Two weeks later (middle panel of Fig. 2), an eddy-like closed flow begins forming in the Kuroshio Extension, and then one clockwise eddy, with a horizontal extent of a few hundred kilometers and a thickness of a few hundred meters, was pinched off from the Kuroshio Extension in a northward direction on January 30, 2002 (right panel of Fig. 2). In this way, there are many clockwise eddies off the east coast of Japan. Next, let's examine the temperature of the eddy (left panel of Fig. 3). At first glance of the eddy has considerably warmer surface waters, about 3°C, compared to the surrounding waters. This is because the eddy pinched off from the warm Kuroshio Extension.
Does the warm eddy influence the overlying atmosphere? To address this question, let's consider the ocean-atmosphere heat exchange (middle panel of Fig. 3). The warm eddy released a huge amount of heat, exceeding 600 W/m2. This release was one of the largest in the world's oceans. Furthermore, surface winds were enhanced over the warm eddy (right panel of Fig. 3). The series of features indicated, "the warm surface waters enhance upward heat release, leading to enhanced surface winds" over the warm eddies off the east coast of Japan. This differs greatly from the heat exchange outlined in the second paragraph; strong winds on the sea surface enhance a heat release from the ocean, resulting in ocean cooling.
In current climate science, various ocean-atmosphere relationships among regions, seasons, and various temporal-spatial scales are starting to become clear when considering heat exchange. Each story between the ocean and atmosphere represents beauty of nature. An understanding of the complicated global climate system can be obtained by combing these stories of the ocean and atmosphere.
Every year our laboratory performs ocean observations by research vessel. Over the sea, you experience a wonderful side of nature that you normally never get to see. Wouldn't you like to have an adventure in oceans and try climate science to discover the beauty of nature? We are looking forward to young people taking up this challenge.
Physical Oeanography Laboratory, Assistant Professor, Shusaku Sugimoto
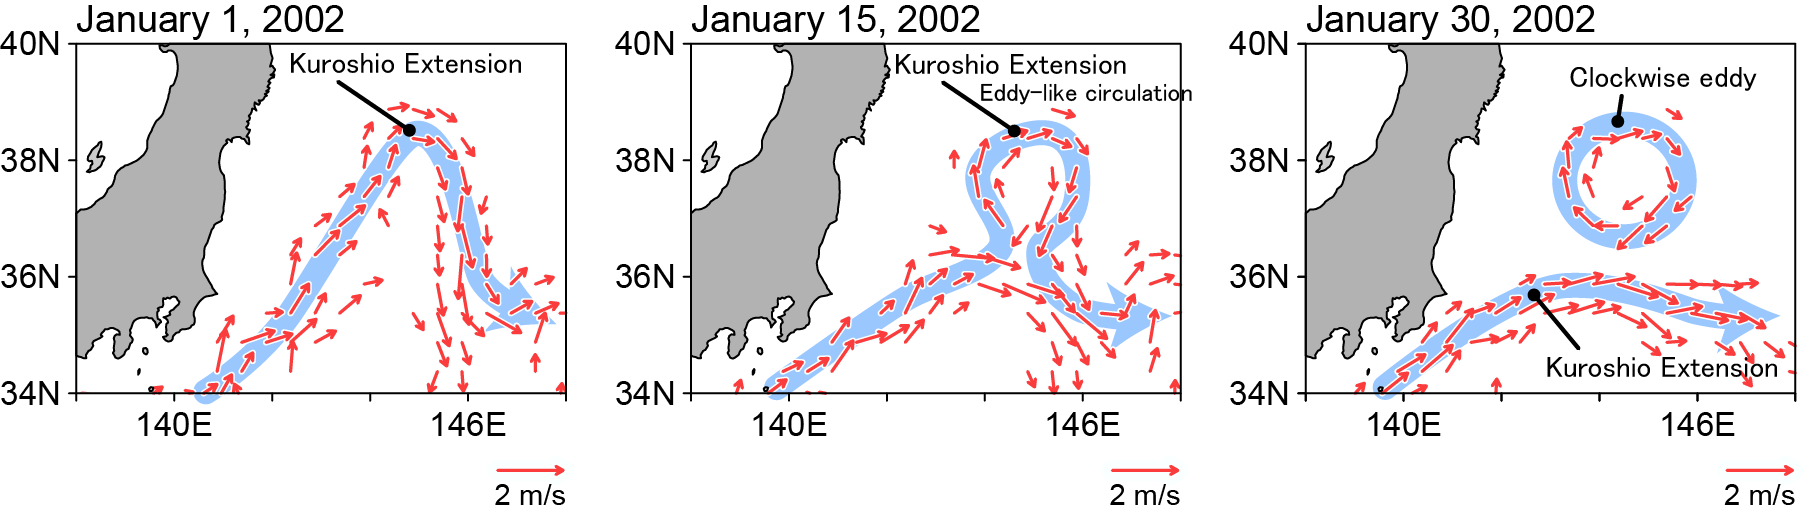
Figure 2. Snapshot of sea surface velocity vectors. Small velocity vectors (< 0.5 m/s) are emitted.
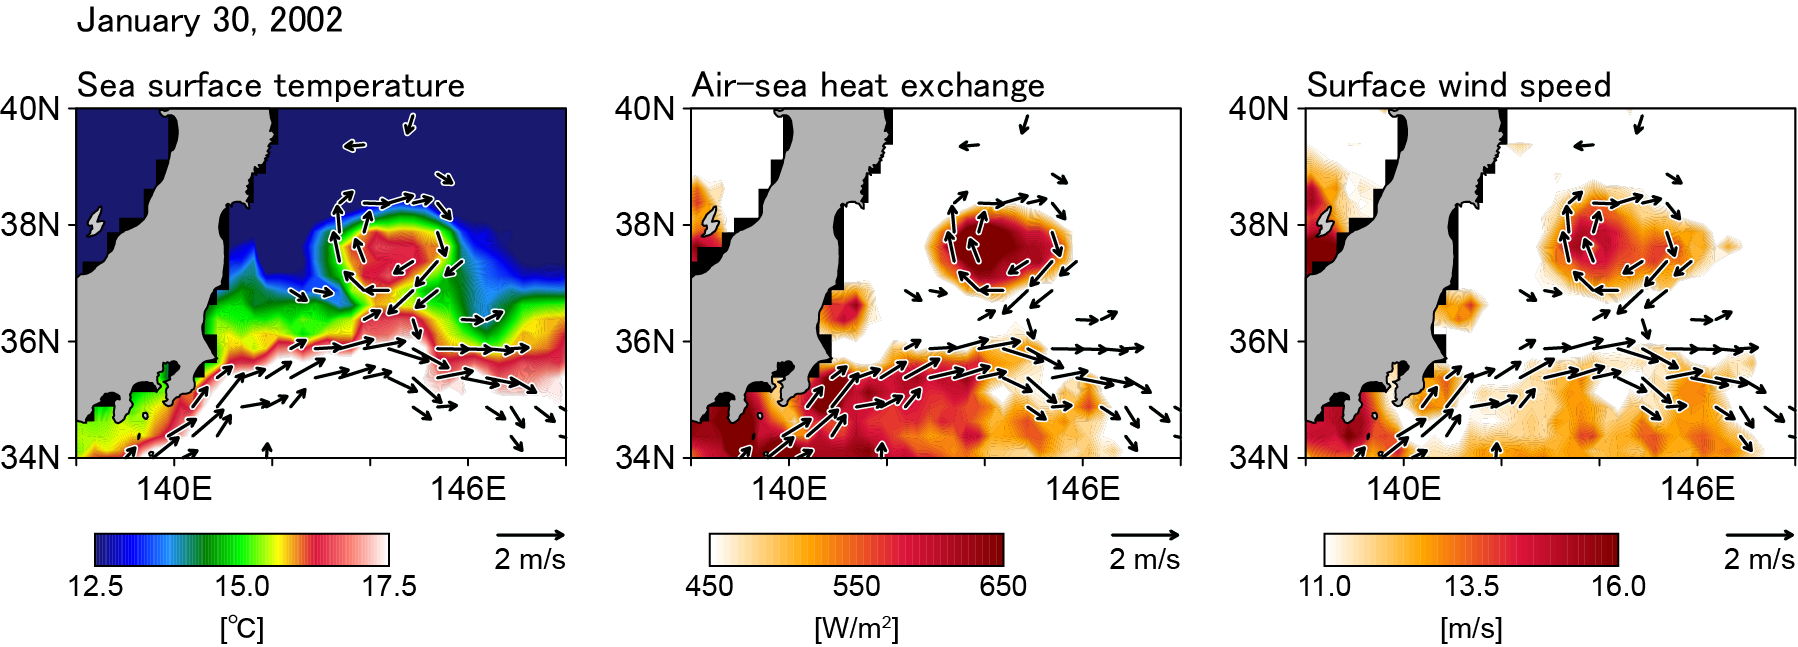
Figure 3. Snapshot of sea surface temperature (left), upward heat release related to the turbulent heat flux (sum of latent and sensible heat fluxes) (middle), and surface wind speed, in January 30, 2002. Arrows indicate sea surface velocity vectors.