Topics 2017.09.22
Ocean Precipitation Long-Term Trend Around Japan
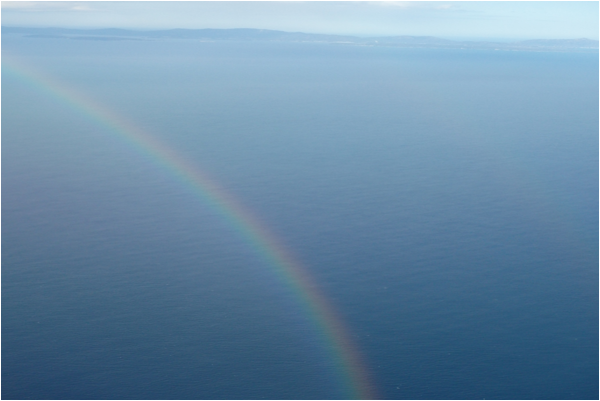 Figure 1: The rainbow at the Sendai Bay taken on Dec.05, 2016.
Here we talk about the long-term trend of the ocean precipitation around Japan. The map of the averaged ocean precipitation around Japan are shown in Figure 2. This figure was made out of the hourly precipiation data from 2007 to 2016 by the Japan Meteorological Agency's numerical model results. According to Figure 2, the high precipitation area, which is colored yellow and red, extends from near Taiwan to the west of Okinawa-Amami Islands in East China Sea. Such area appears in the sea south of Kyushu, Shikoku and Honshu Islands and also appears in the sea east of Boso Penunsula. It is noted that the distribution of these high precipitation areas corresponds well to the ocean currents, Kuroshio and Kuroshio Extension.
Figure 2 also shows the averaged precipiation over the land. The averaged land precipiation is clearly affected by geographical features, such as mountains and valleys. On the other hand, the ocean current seems to play an important role in making the long-term trend of the ocean precipiation. As mentiond above, Kuroshio and Kuroshio Extension could make a bias of the precipiation in the ocean around Japan. Note that Figure 2 was made only by the numerical model results. Further study is needed to be closer to the real of the ocean precipitation.
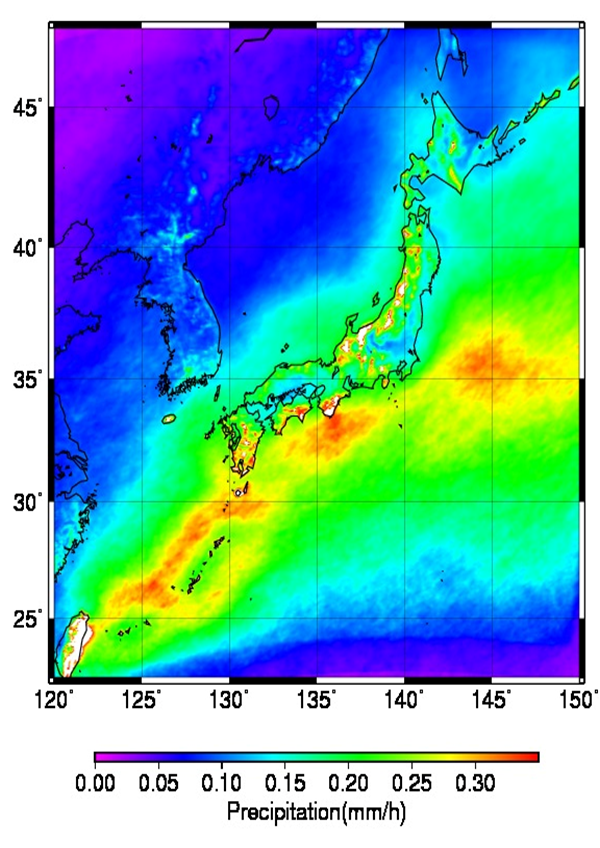
Figure 2: The averaged precipiation map around Japan. The hourly precipiation data from 2007 to 2016 by Japan Meteorological Agency's numerical forecast model outputs are used.
(by Futoki Sakaida and Kazuki Hidaka, Satellite oceanography laboratory, CAOS)