Topics 2023.08.30
Learning the history of our society through the history of ocean measurements
The Kuroshio, one of the most vigorous ocean currents on Earth, has been in the regime of "large meander" (blue circle in Fig.1) since the summer of 2017, which is often described as "the longest" in recorded history. The current is also exhibiting an extraordinary northward excursion offshore of Sanriku (red circle in Fig.1), which had not occurred in the last several decades. This "anomalous" state of Kuroshio has astonished and is intriguing many oceanographers who are familiar with the textbooks that described the current as leaving Japan further south.
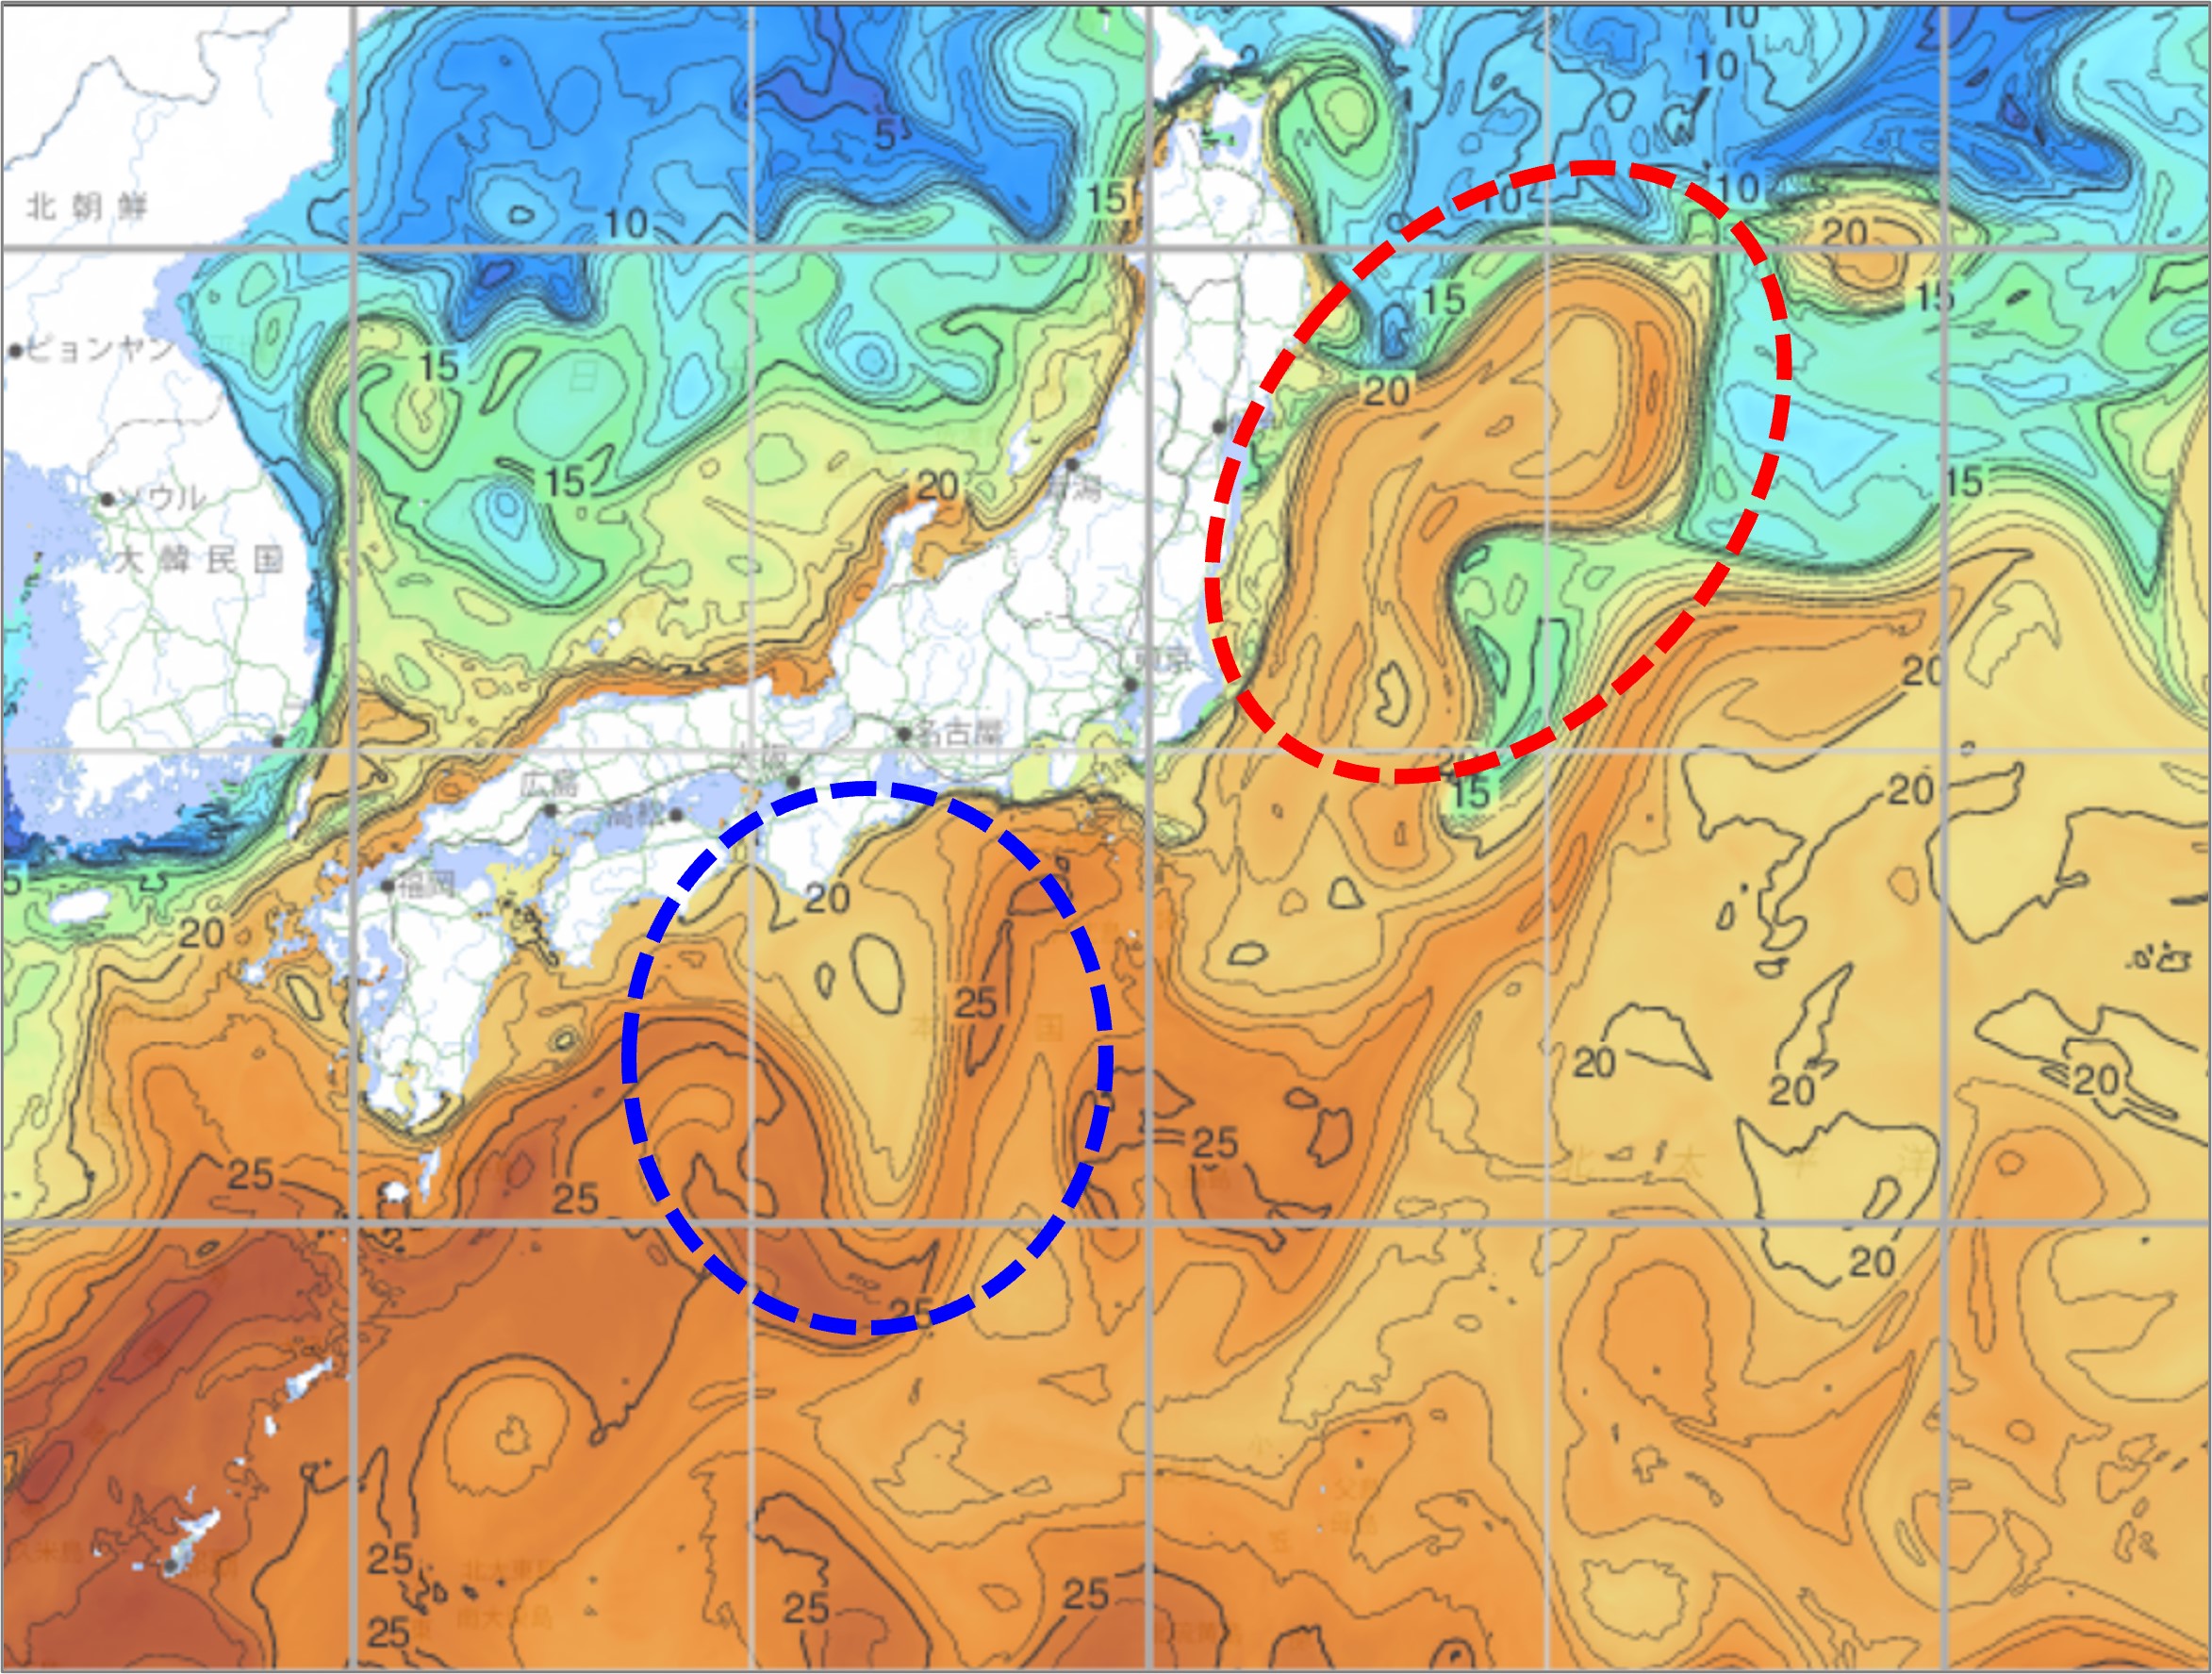
Fig.1 The spatial distribution of 50m-depth ocean temperature near eastern Japan on July 15, 2023 (copied from JMA's website*1). Warmer Kuroshio water is extending as far north as Sanriku (i.e., the Pacific coast of Tohoku region).
The large meander of the Kuroshio is now known to be quite common. Another long meander event occurred when Japan was in the war period (Fig.2). It is documented as having lasted for 11 years (1934-1945) but is often omitted from the "recorded history" since the measurements during the period are not thought to be sufficient.
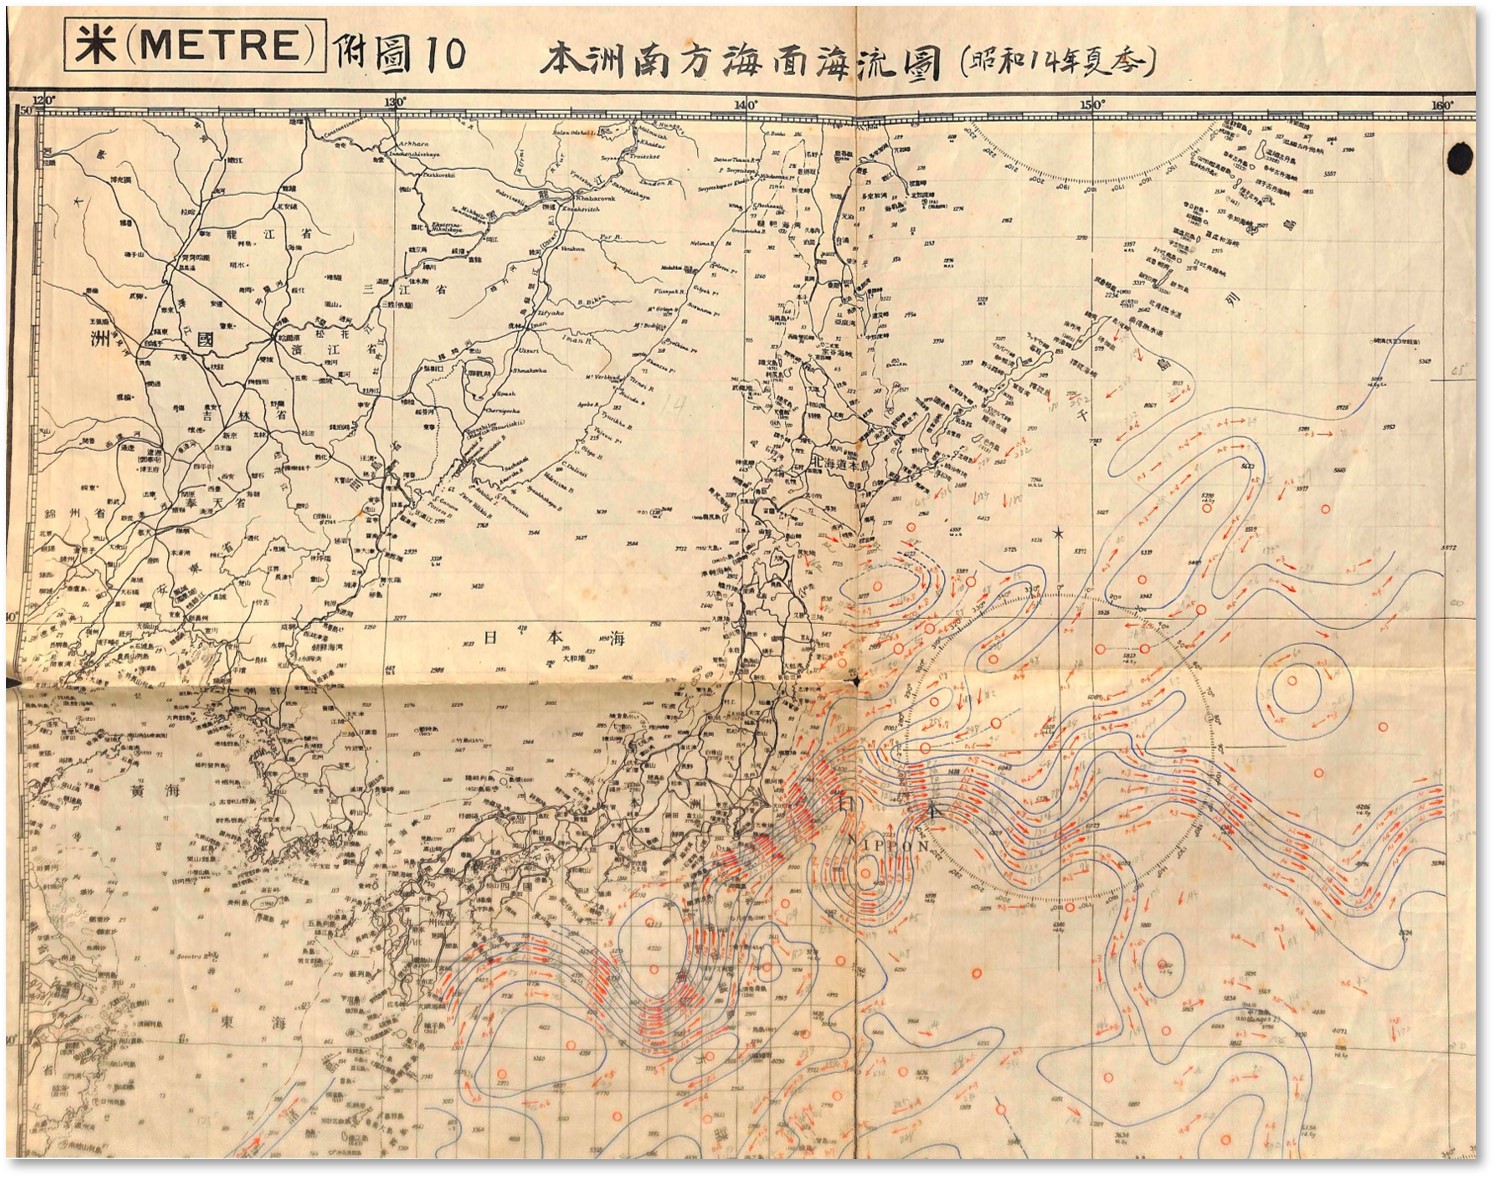
Fig.2 A chart drawn by the old Japanese Imperial Navy to summarize the situation of surface currents in the summer of 1939. The large meander of Kuroshio to the south of Japan is depicted.
The wartime meander was captured by a series of large-scale ocean surveys, which were the result of enthusiasm of pioneers in Japanese oceanography and the state policy of the former imperial Japan, which experienced a blunder in naval exercises due to ignorance of such oceanic variability.
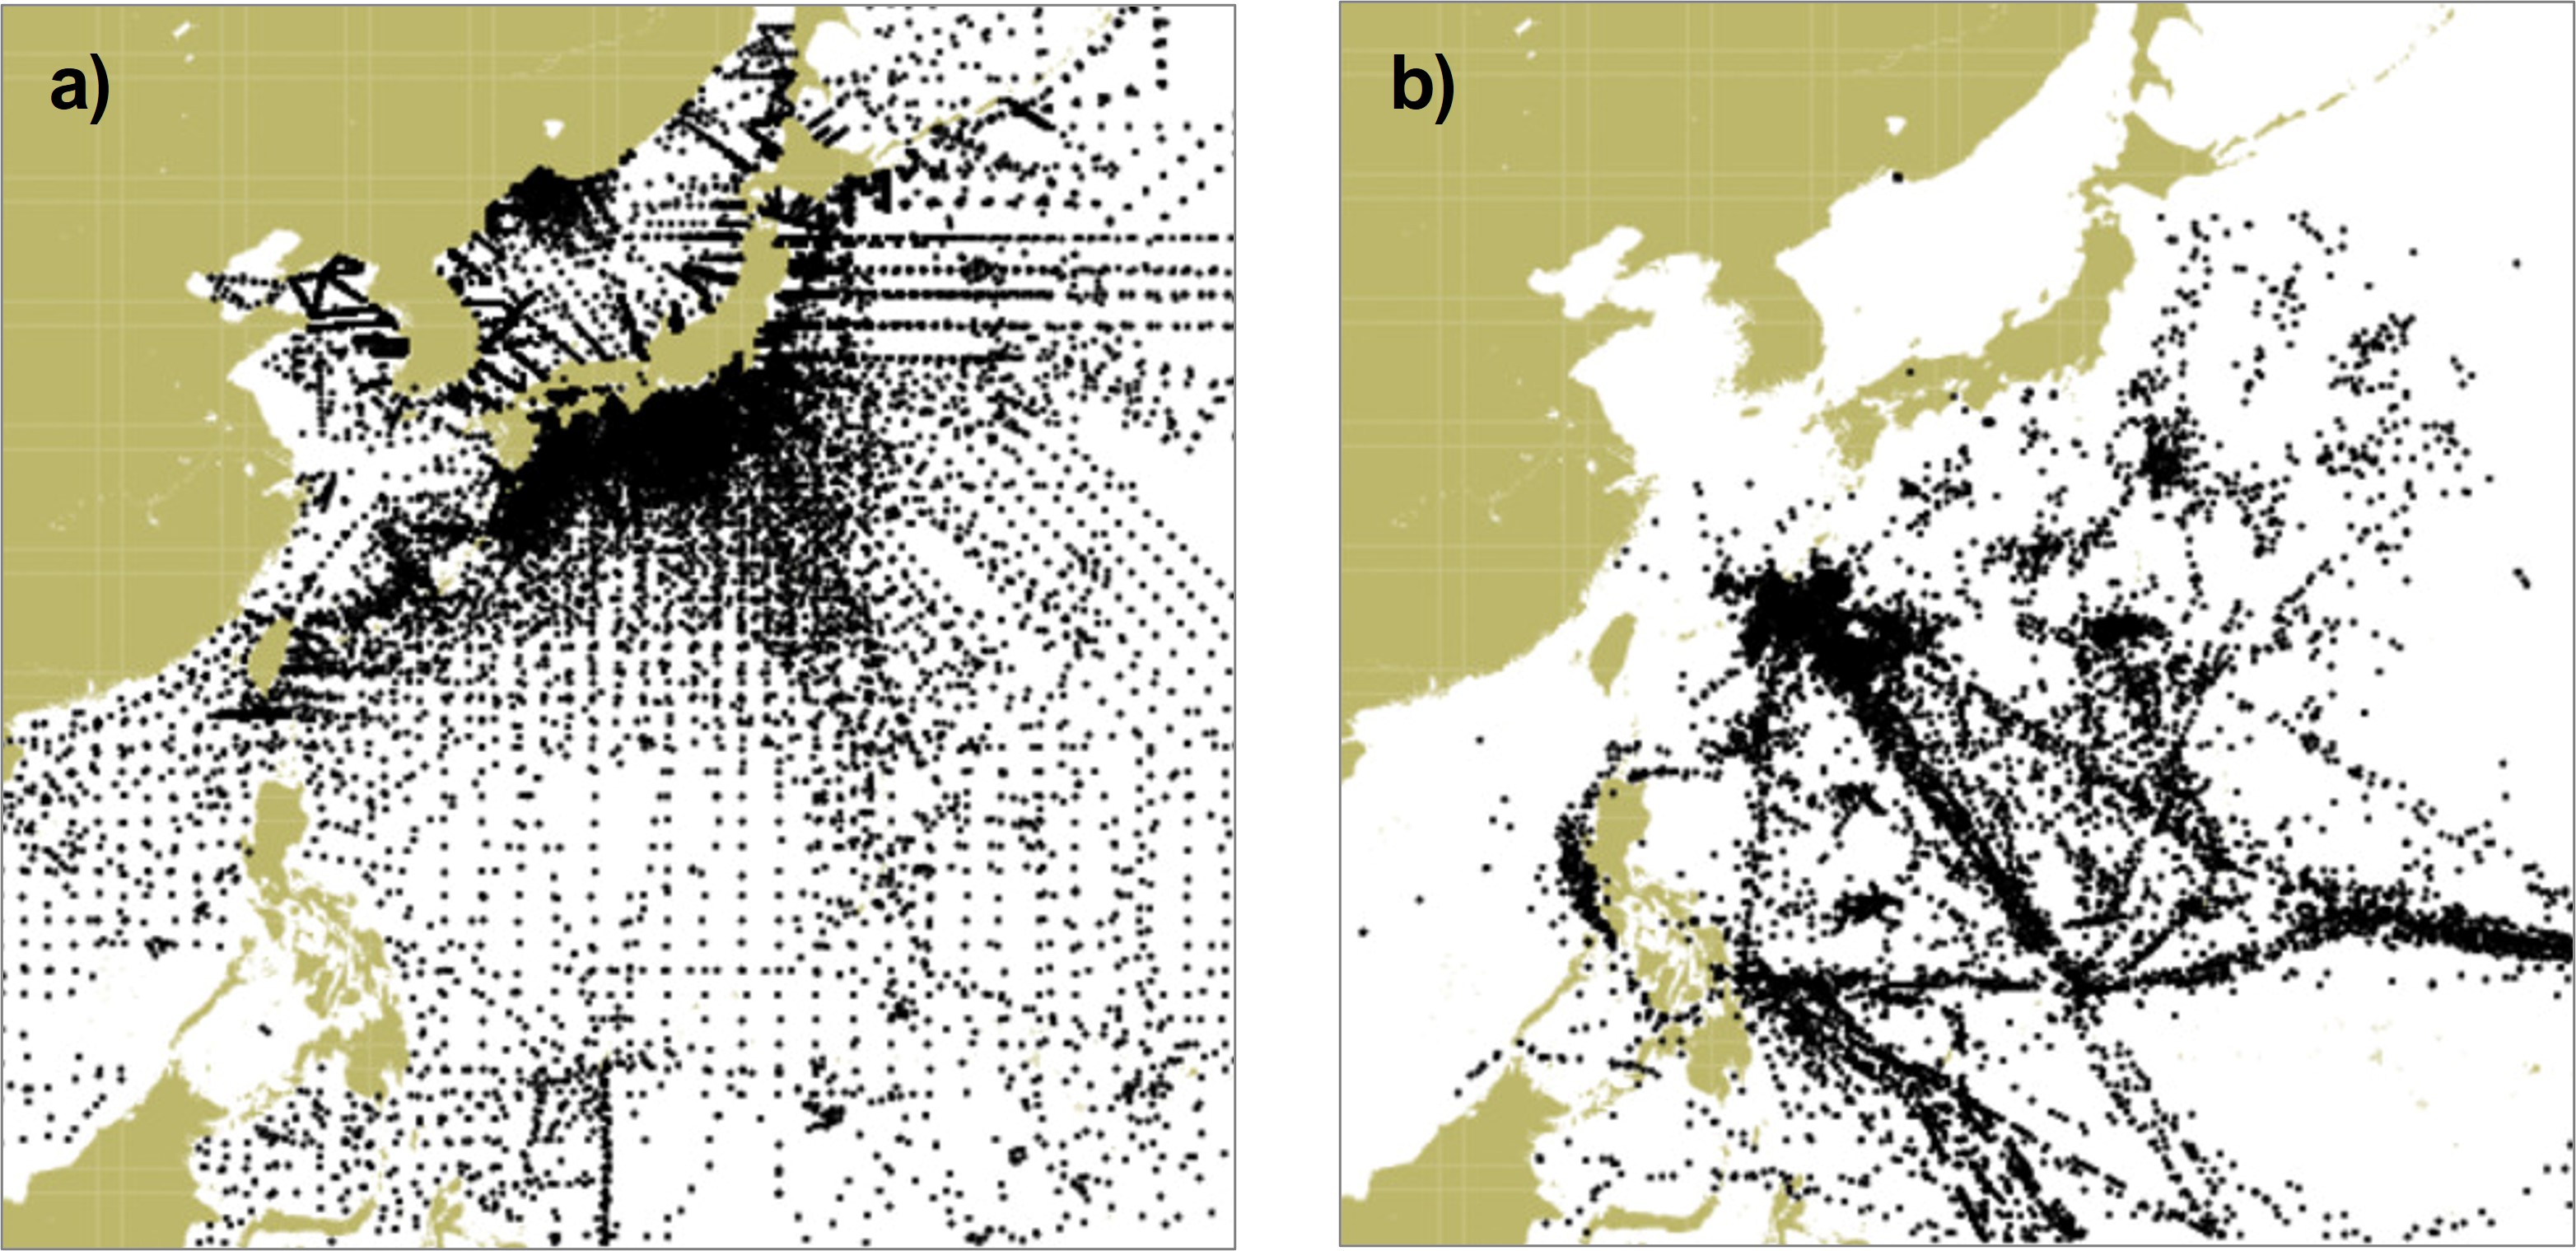
Fig.3 The distribution of hydrographic measurements during 1938-1941 (a; left) and January-August 1945 (b; right). Based on data in the World Ocean Database 2018*2.
Figure 3 shows the spatial distribution of hydrographic measurements in the north-western Pacific during the war period. The left panel (Fig.3a) covers four years up to the very early stage of the Pacific War, and the right panel (Fig.3b) the final eight months of the war. Most of the ~25,000 observations shown in Fig.3a were taken by Japanese ships, which include lots of research vessels, patrol ships, and civilian boats (e.g., whale catchers) which contributed systematically to those simultaneous surveys. The ~8600 observations shown in Fig.3b, in contrast, were taken by US vessels with the help of a "new" type of instrument called mechanical bathythermograph (MBT) which enabled quicker underway profiling of ocean temperature. The fact that the latter are concentrated near Okinawa, Iōtō Island, and other southern isles tells that those measurements were made on the way to/from those battlefields. Most of the Japanese ships contributing to the left plot had been military-requisitioned and subsequently lost in the war. This simple comparison tells us how ocean measurements have been affected and often limited by politics and the history of human society.
The history of measurements is the history of sensor technology. Wartime Japan did not have MBTs, and the data shown in Fig.3a were solely taken by traditional bottle sampling, which requires the vessel to stop and operate a winch for every profile. Many other types of instruments have been developed and used by now (Fig.4), and they make up our community's ocean database with which we learn how the ocean is warming.
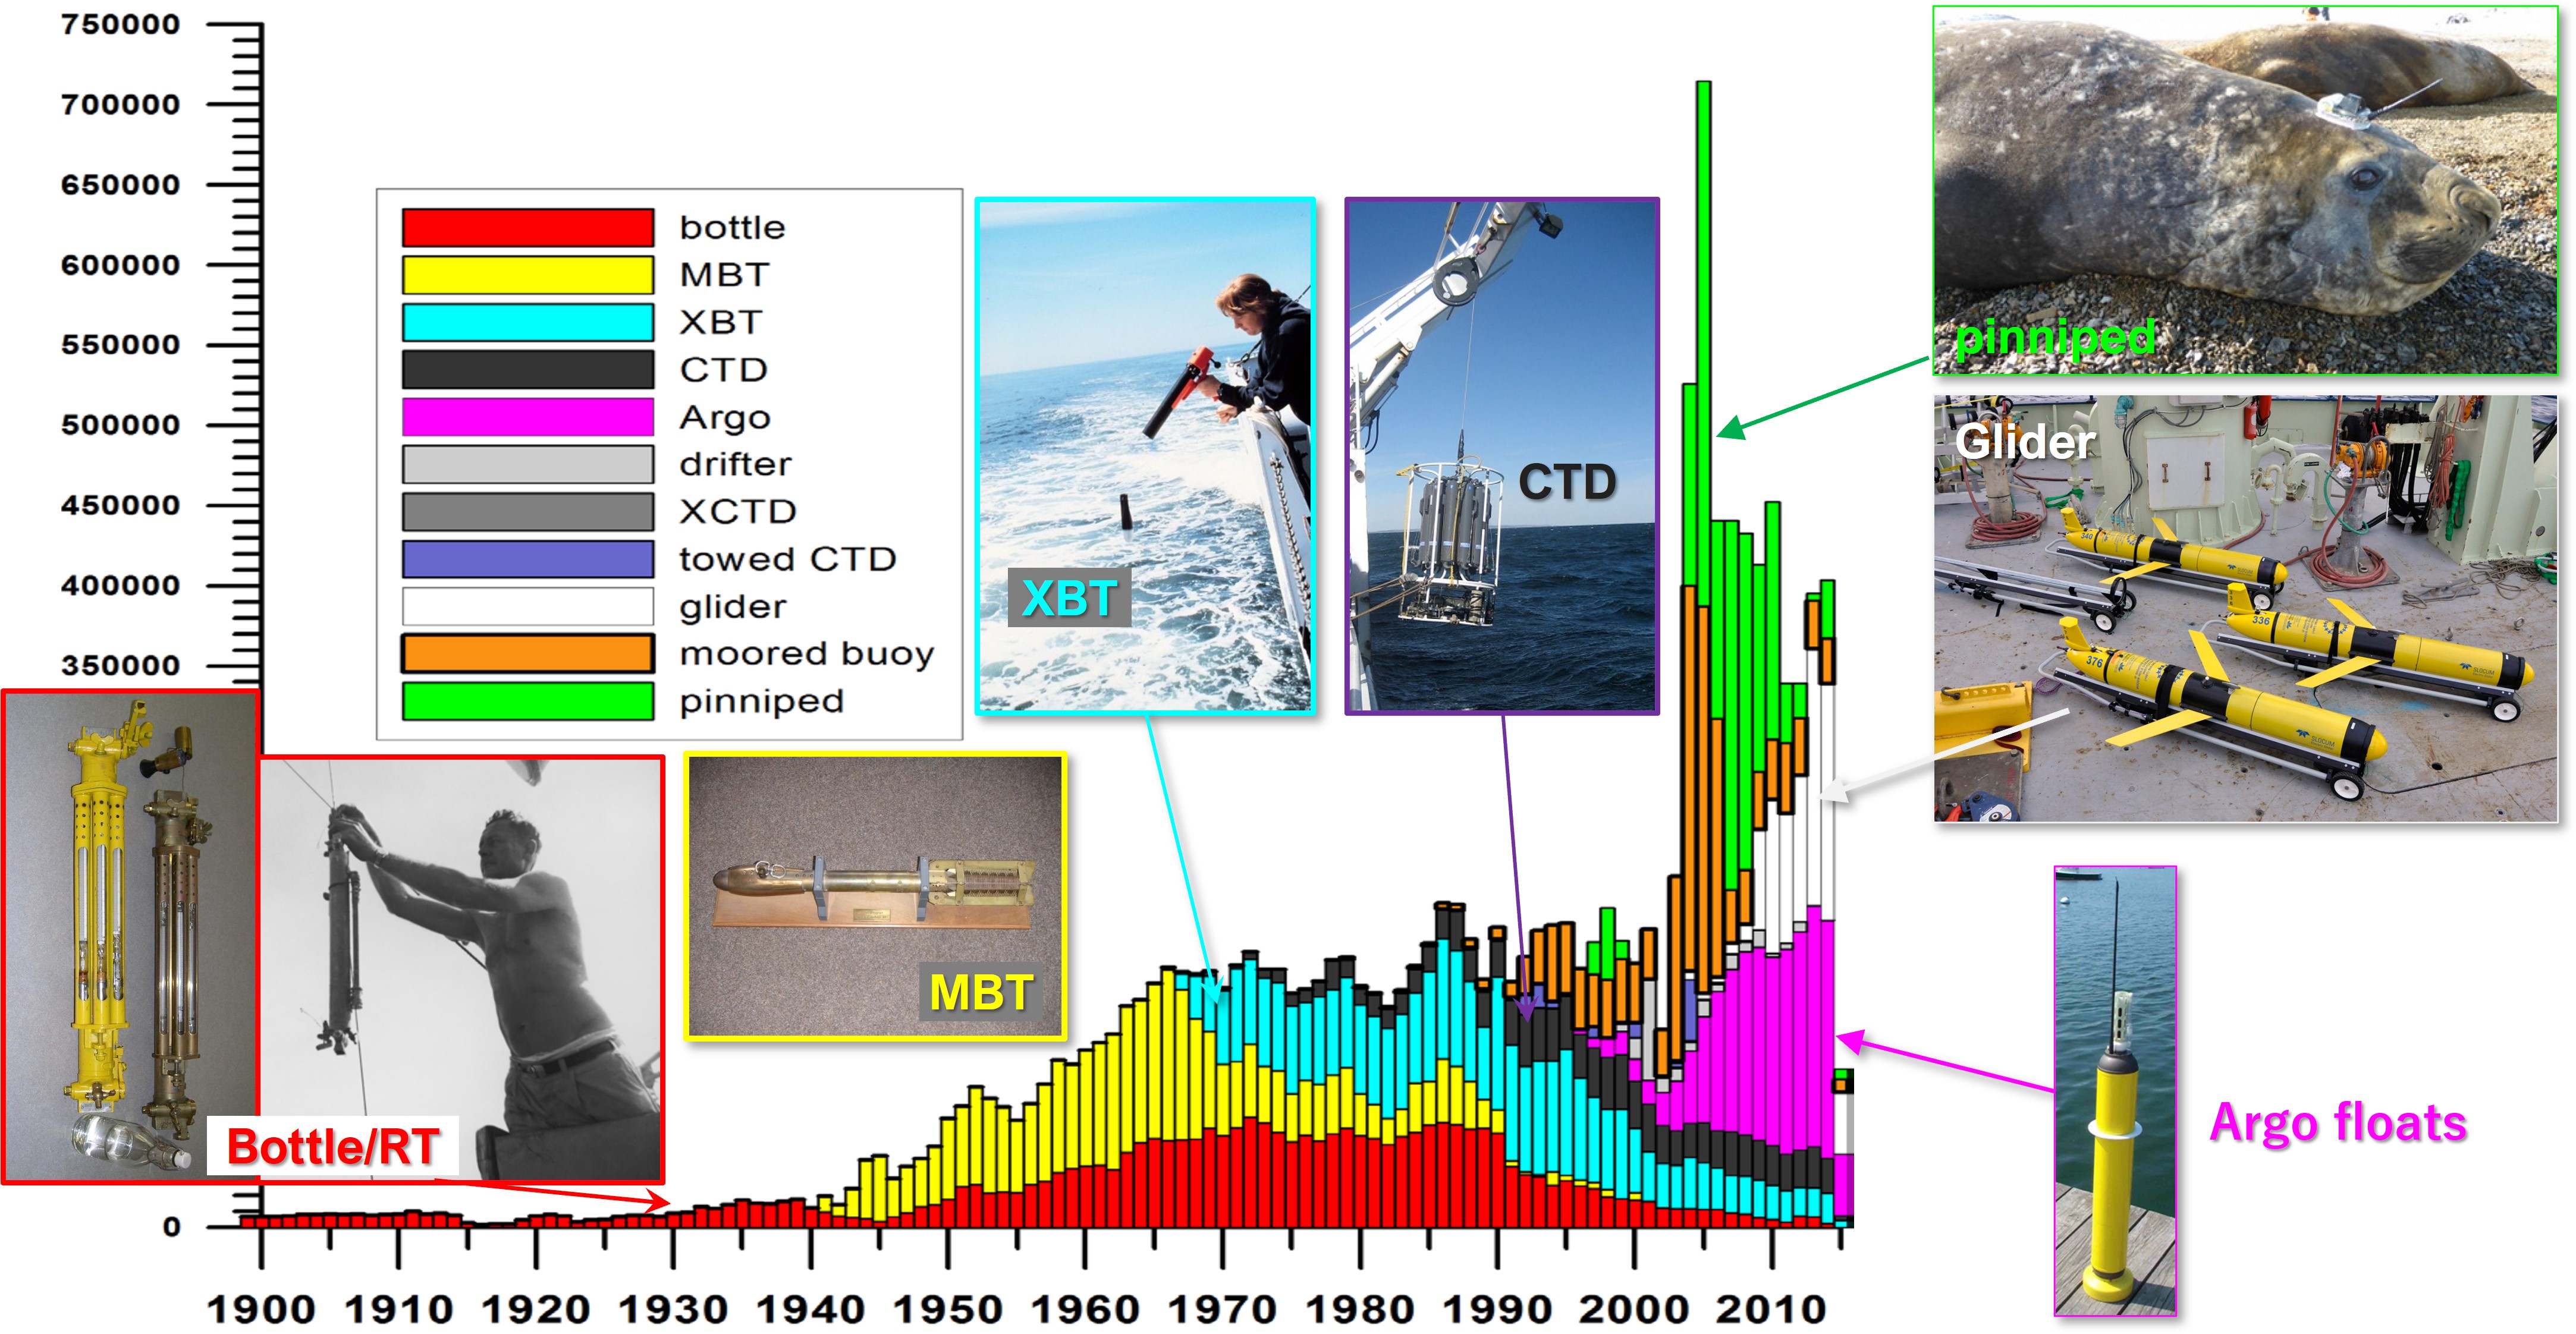
Fig.4 Year-to-year breakdown of instruments used for thermal profiling of the ocean. The bar plot is produced by Domingues and Palmer (2015) *3.
In the last decade, an international research community has been reviewing the transitions in measurement methodologies and re-evaluating their quality, with the goal of assigning reliable error and uncertainty estimates to the historical ocean database*4. Old measurements often lack sufficient information about how the data were collected, and many of them even lack by whom they were collected. Their time stamps and locations are occasionally wrong, and all types of such important "metadata" are subject to potential errors and uncertainties. It is not easy to check many millions of profile data, but persistent effort has been paid in order to know how the past impacts the present and future. And naturally, such attempts provide us with an opportunity to re-learn the history of engineering, scientific interests and demands, and the change of international society.
*1: Subsurface temperature and surface current analysis by Japan Meteorological Agency
https://www.data.jma.go.jp/gmd/kaikyou/kaikyou/tile/jp/index_subsanl.html
*2: World Ocean Database
https://www.ncei.noaa.gov/products/world-ocean-database
*3: Domingues, C., and M. Palmer (2015): The IQuOD initiative: towards an International Quality controlled Ocean Database. CLIVAR Exchanges No. 67, Vol. 19, No. 2, Sep 2015.
*4: International Quality-controlled Ocean Database (IQuOD)
(By Shoichi Kizu, Physical Oceanography Laboratory)