Topics 2026.01.04
Hot mantle flow beneath subducting slabs revealed by whole-mantle tomography
We investigate deep mantle structure beneath subduction zones, which has received relatively little attention in previous studies. To achieve this, we employ a new approach of seismic tomography, which is a powerful method for exploring the Earth's interior structure.
Seismic tomography enables us to obtain detailed three-dimensional images of the Earth's interior with a principle similar to that of medical CT scans (see Topics #13). Tomographic studies of subduction zones have consistently revealed three characteristic features, namely, (1) a high-velocity anomaly reflecting the subducting plate (=slab), (2) low-velocity anomalies above the slab associated with arc magmatism (=above-slab low-velocity anomalies, ALVAs), and (3) low-velocity anomalies distributed beneath the slab (=sub-slab low-velocity anomalies, SLVAs) (Fig. 1).
Among these features, however, SLVAs have long attracted limited attention. This is mainly because most previous studies focused on depths shallower than the mantle transition zone (410-660 km depths). As a result, it has been difficult to explore these structures with sufficient reliability or to determine how deep they extend.
A new perspective on this problem has been provided by high-resolution seismic tomography targeting the entire mantle. Our group has developed a tomographic method that enables high-resolution imaging of the whole crust and mantle as a unified system, i.e., from the Earth's surface down to the core-mantle boundary at ~2,900 km depth. This approach is known as multi-scale global tomography (Zhao et al., 2017).
Tomographic images beneath Southeast Asia clearly show that SLVAs are continuous from the lower mantle (Toyokuniet al., 2022; Fig. 2). These anomalies are interpreted as hot mantle upwelling from the lower mantle. The subducting slab usually stagnates in the mantle transition zone and intermittently sinks into the lower mantle. The low-velocity anomalies below the slab are thus interpreted as hot mantle return flows generated during slab descent and trapped immediately beneath the slab. This is a new interpretation supported by our results.
In addition, the slab often contains holes or tears, known as slab windows. Our images suggest that hot material beneath the slab ascends through these slab windows and mixes with arc magmas. Notably, volcanoes that have produced caldera-forming eruptions are frequently located directly above or very close to such slab windows. This spatial relationship implies that energy supply from the lower mantle may play an important role in triggering large-scale volcanic eruptions (Toyokuni et al., 2022; Fig. 2).
Similar features are also identified around Japan, particularly beneath the Kuril arc. The subducting Pacific slab contains multiple slab windows, through which hot mantle material rises and interacts with arc magmatism (Toyokuni et al., 2025; Fig. 3). We have identified comparable structures beneath many subduction zones worldwide, including the Mediterranean region, New Zealand, and South America. These observations suggest that large explosive eruptions should be understood not merely as local phenomena, but as manifestations of global-scale processes linking slab structures with hot mantle upwellings from deep within the Earth.
Furthermore, by incorporating seismic anisotropy into our tomographic analyses (see Topics #13), we can now visualize not only static features but also directions of mantle flow (Toyokuni et al., 2025; Fig. 4). This advancement allows us to investigate dynamic processes such as slab tearing, deformation, and the mantle flow responses to these structural changes.
SLVAs are thought to influence slab dynamics through buoyancy, heat, and the supply of fluids, and may also affect earthquake generation. Although SLVAs themselves do not directly cause natural disasters, they represent a key factor that modulates a wide range of seismic and volcanic phenomena in subduction zones. Whole-mantle tomography, which extends our view into the lower mantle, provides essential insights for achieving a deeper and more integrated understanding of these complex geodynamic processes.
References
Zhao, D., M. Fujisawa & G. Toyokuni (2017) Tomography of the subducting Pacific slab and the 2015 Bonin deepest earthquake (Mw 7.9). Sci. Rep. 7, 44487. https://doi.org/10.1038/srep44487
Toyokuni, G., D. Zhao & K. Kurata (2022) Whole-mantle tomography of Southeast Asia: New insight into plumes and slabs. J. Geophys. Res. Solid Earth 127, e2022JB024298. https://doi.org/10.1029/2022JB024298
Toyokuni, G., D. Zhao & D. Takada (2025) Whole-mantle isotropic and anisotropic tomography beneath Japan and adjacent regions. J. Geophys. Res. Solid Earth 130, e2024JB029593. https://doi.org/10.1029/2024JB029593
Authors:
Genti Toyokuni (Associate Professor) & Dapeng Zhao (Professor)
Subduction Zone Science Laboratory, Solid Earth Physics (Field A)
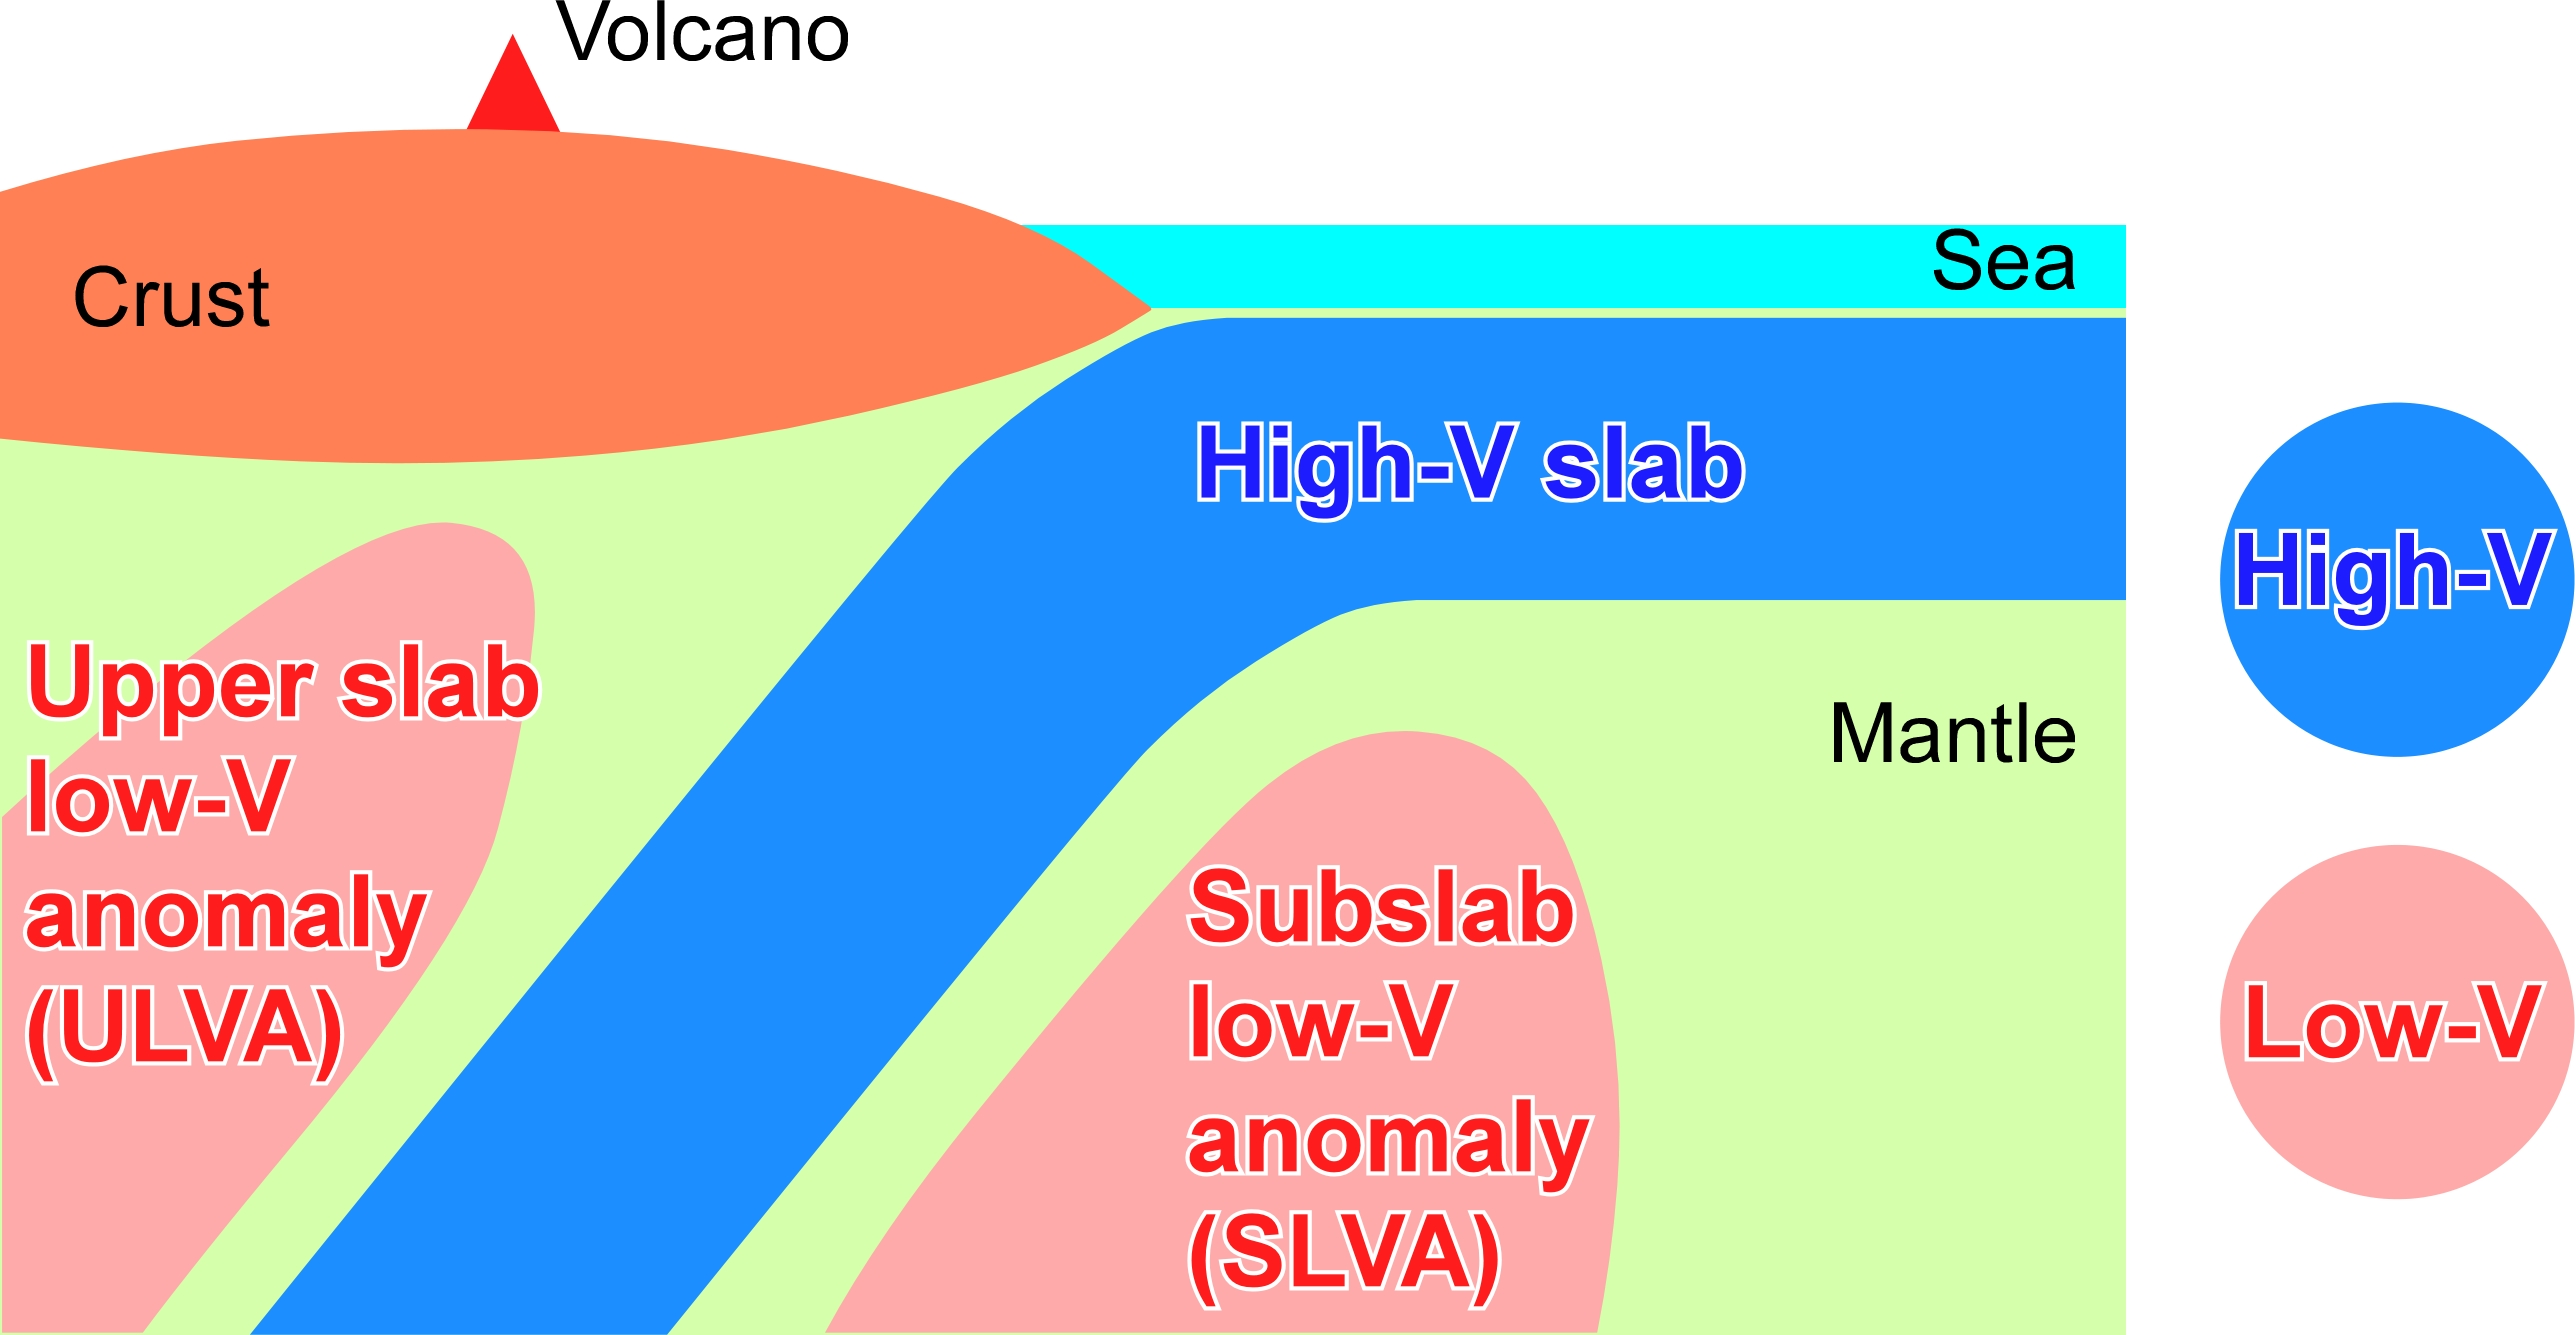
Figure 1. Common features observed in seismic tomography of subduction zones. A schematic cross-section above the upper mantle is shown. Blue and red colors indicate high- and low-velocity anomalies, respectively. The subducting slab is cold and is imaged as a high-velocity anomaly. Above the slab, a low-velocity anomaly associated with arc magmatism, referred to as the above-slab low-velocity anomaly (ALVA), is commonly observed. In addition, a sub-slab low-velocity anomaly (SLVA) is typically imaged beneath the slab.
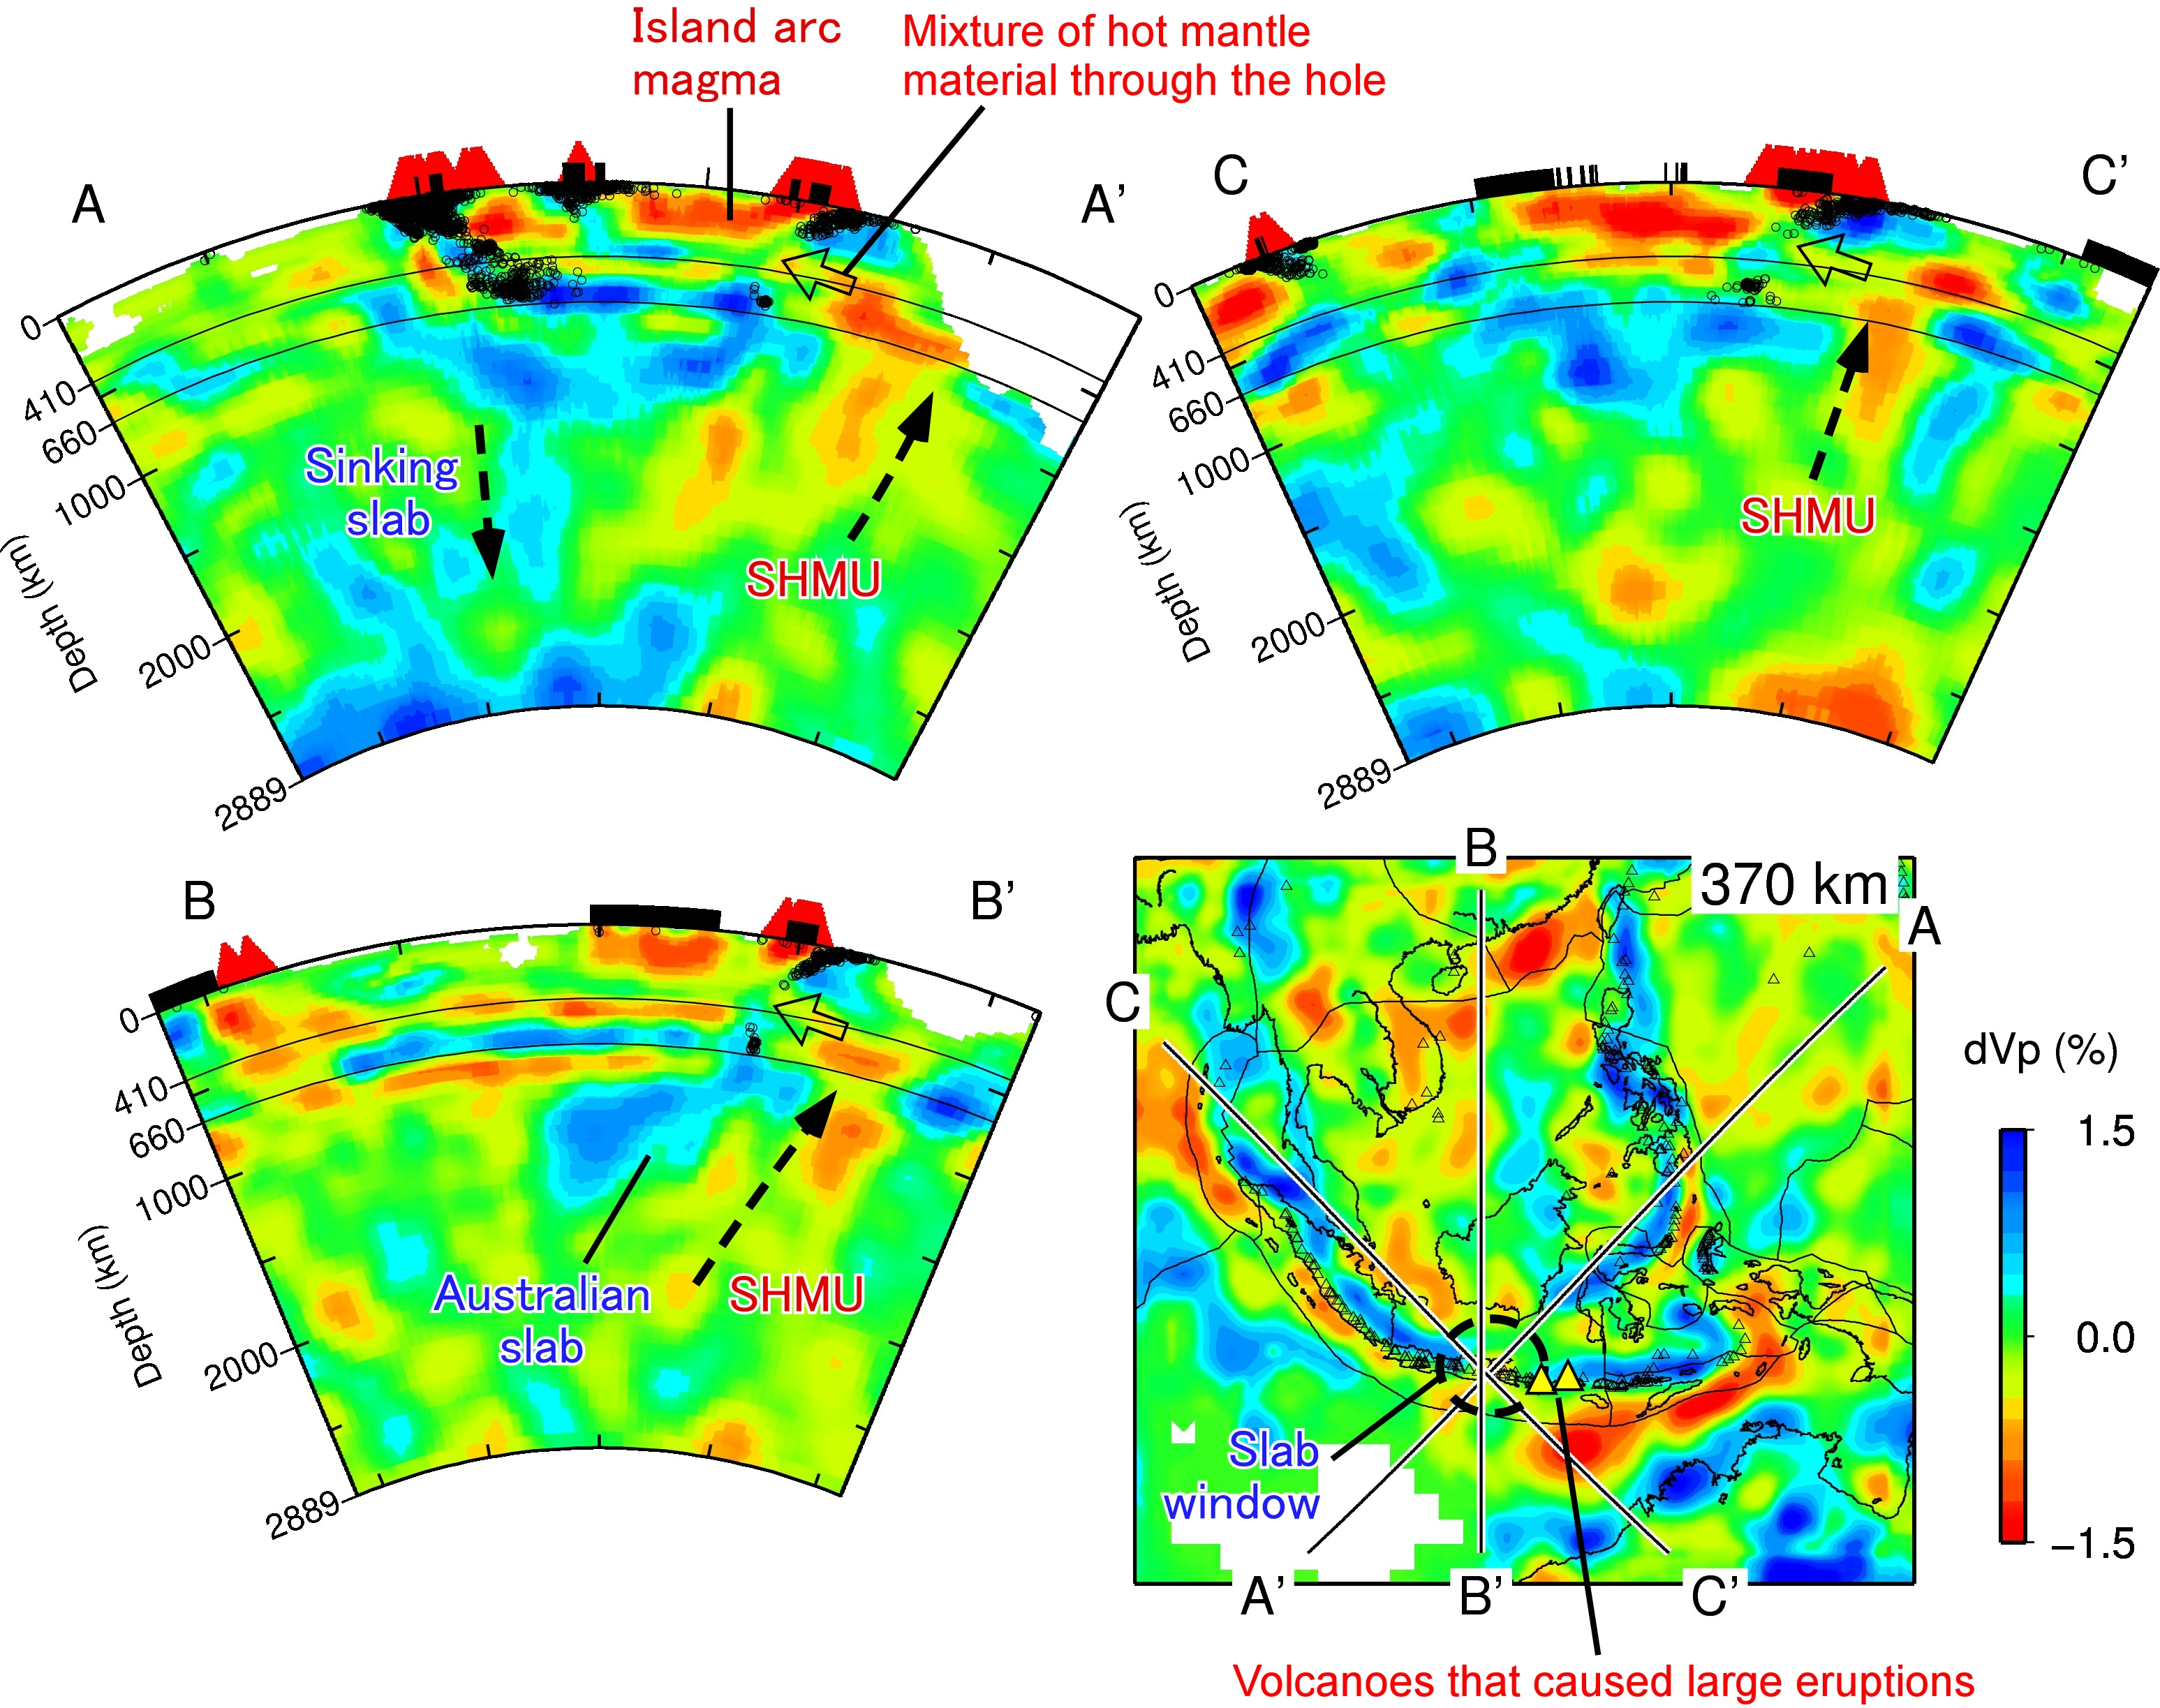
Figure 2. Three tomographic cross-sections passing through a slab window beneath western Java, Southeast Asia (Toyokuni et al., 2022). The blue and red colors denote high and low isotropic P-wave velocities, respectively, whose scale (in %) is shown at the bottom right. The subducting Australian slab, shown in blue, is disrupted at depths of ~300-400 km, indicating the presence of a slab window. Active volcanoes within a ±2° width and local seismicity within a ±1°width of each profile are shown as red triangles and white circles, respectively. SHUM (sub-slab hot mantle upwelling) represents one possible interpretation of sub-slab low-velocity anomaly (SLVA). The locations of the cross sections are shown in the map view. The map also displays tomographic results at a depth of 370 km, where the slab window is highlighted by the dashed circle. Open triangles indicate active volcanoes; those that have produced recent large explosive eruptions are emphasized by larger yellow symbols.
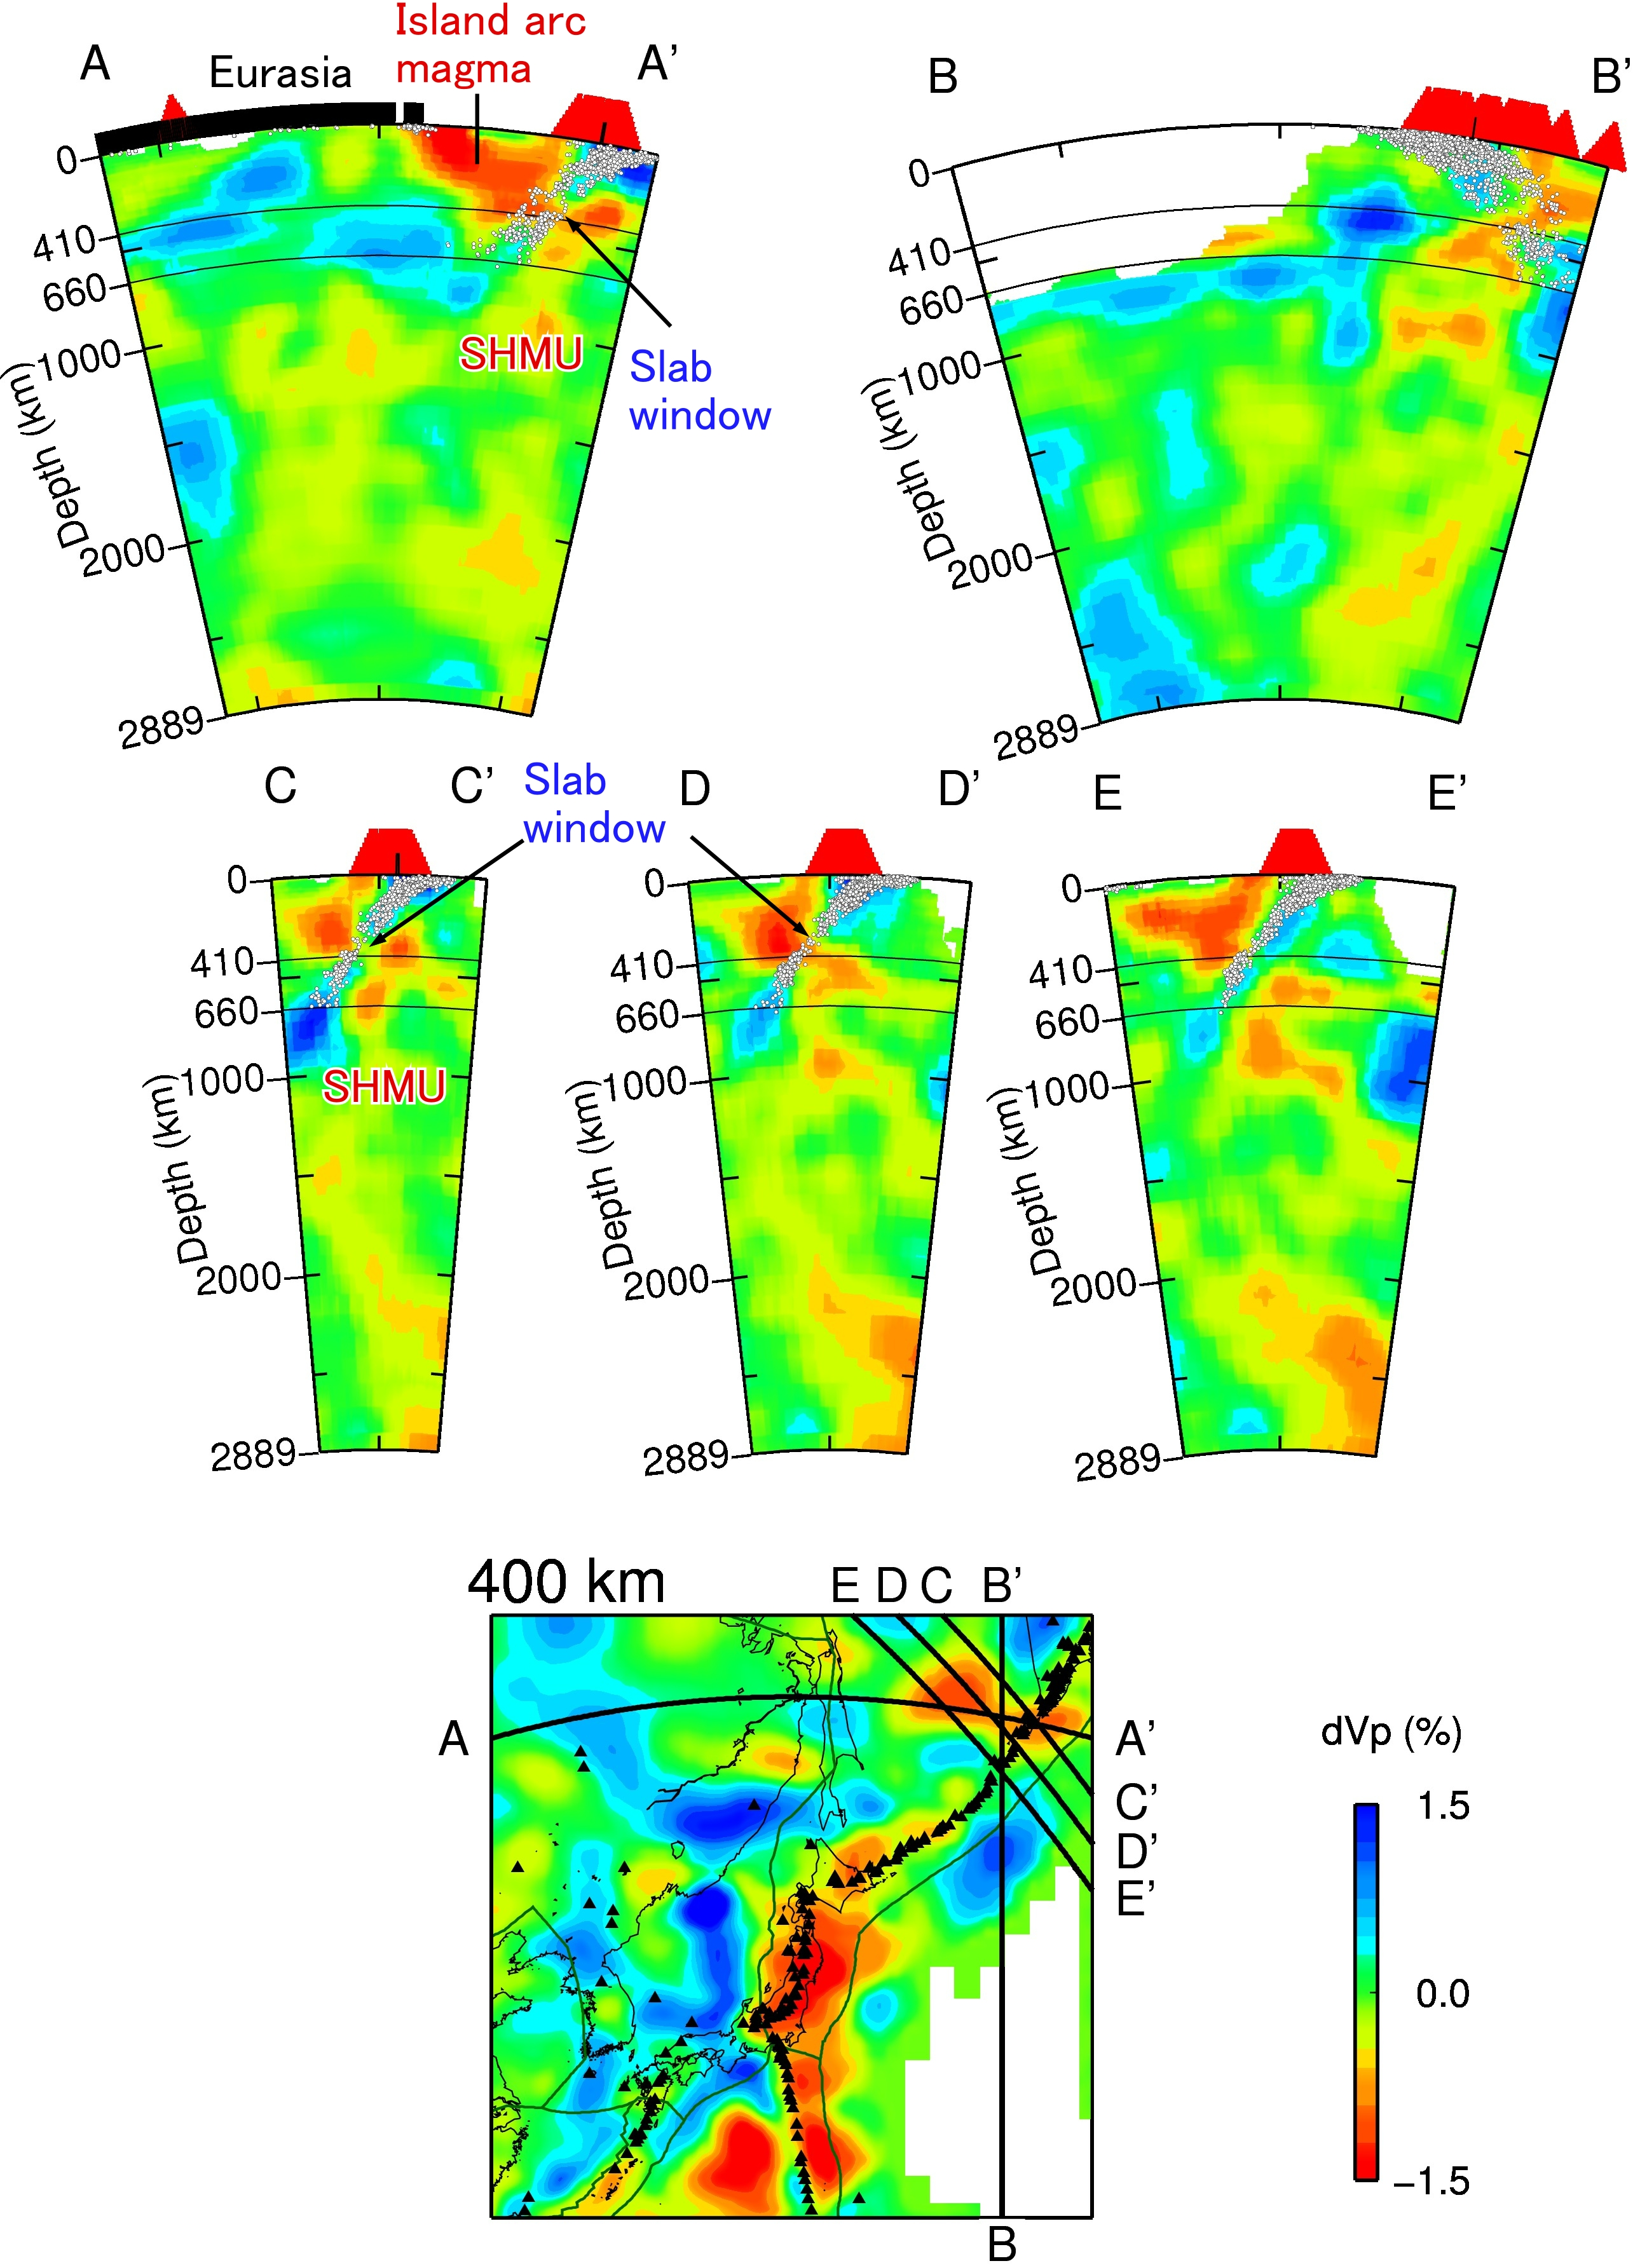
Figure 3. Vertical cross-sections of our isotropic tomography along five profiles passing through the Kuril subduction zone (Toyokuni et al., 2025). The blue and red colors denote high and low isotropic P-wave velocities, respectively, whose scale (in %) is shown at the bottom right. In the A-A', C-C', and D-D' sections, the subducted Pacific slab in blue color is seen to be interrupted around a depth of 400 km, which might be a slab window. Active volcanoes within a ±2°width and local seismicity within a ±1° width of each profile are shown as red triangles and white circles, respectively. SHUM (sub-slab hot mantle upwelling) represents one possible interpretation of sub-slab low-velocity anomaly (SLVA). Locations of the profiles are shown on the map that displays isotropic image at 400 km depth.
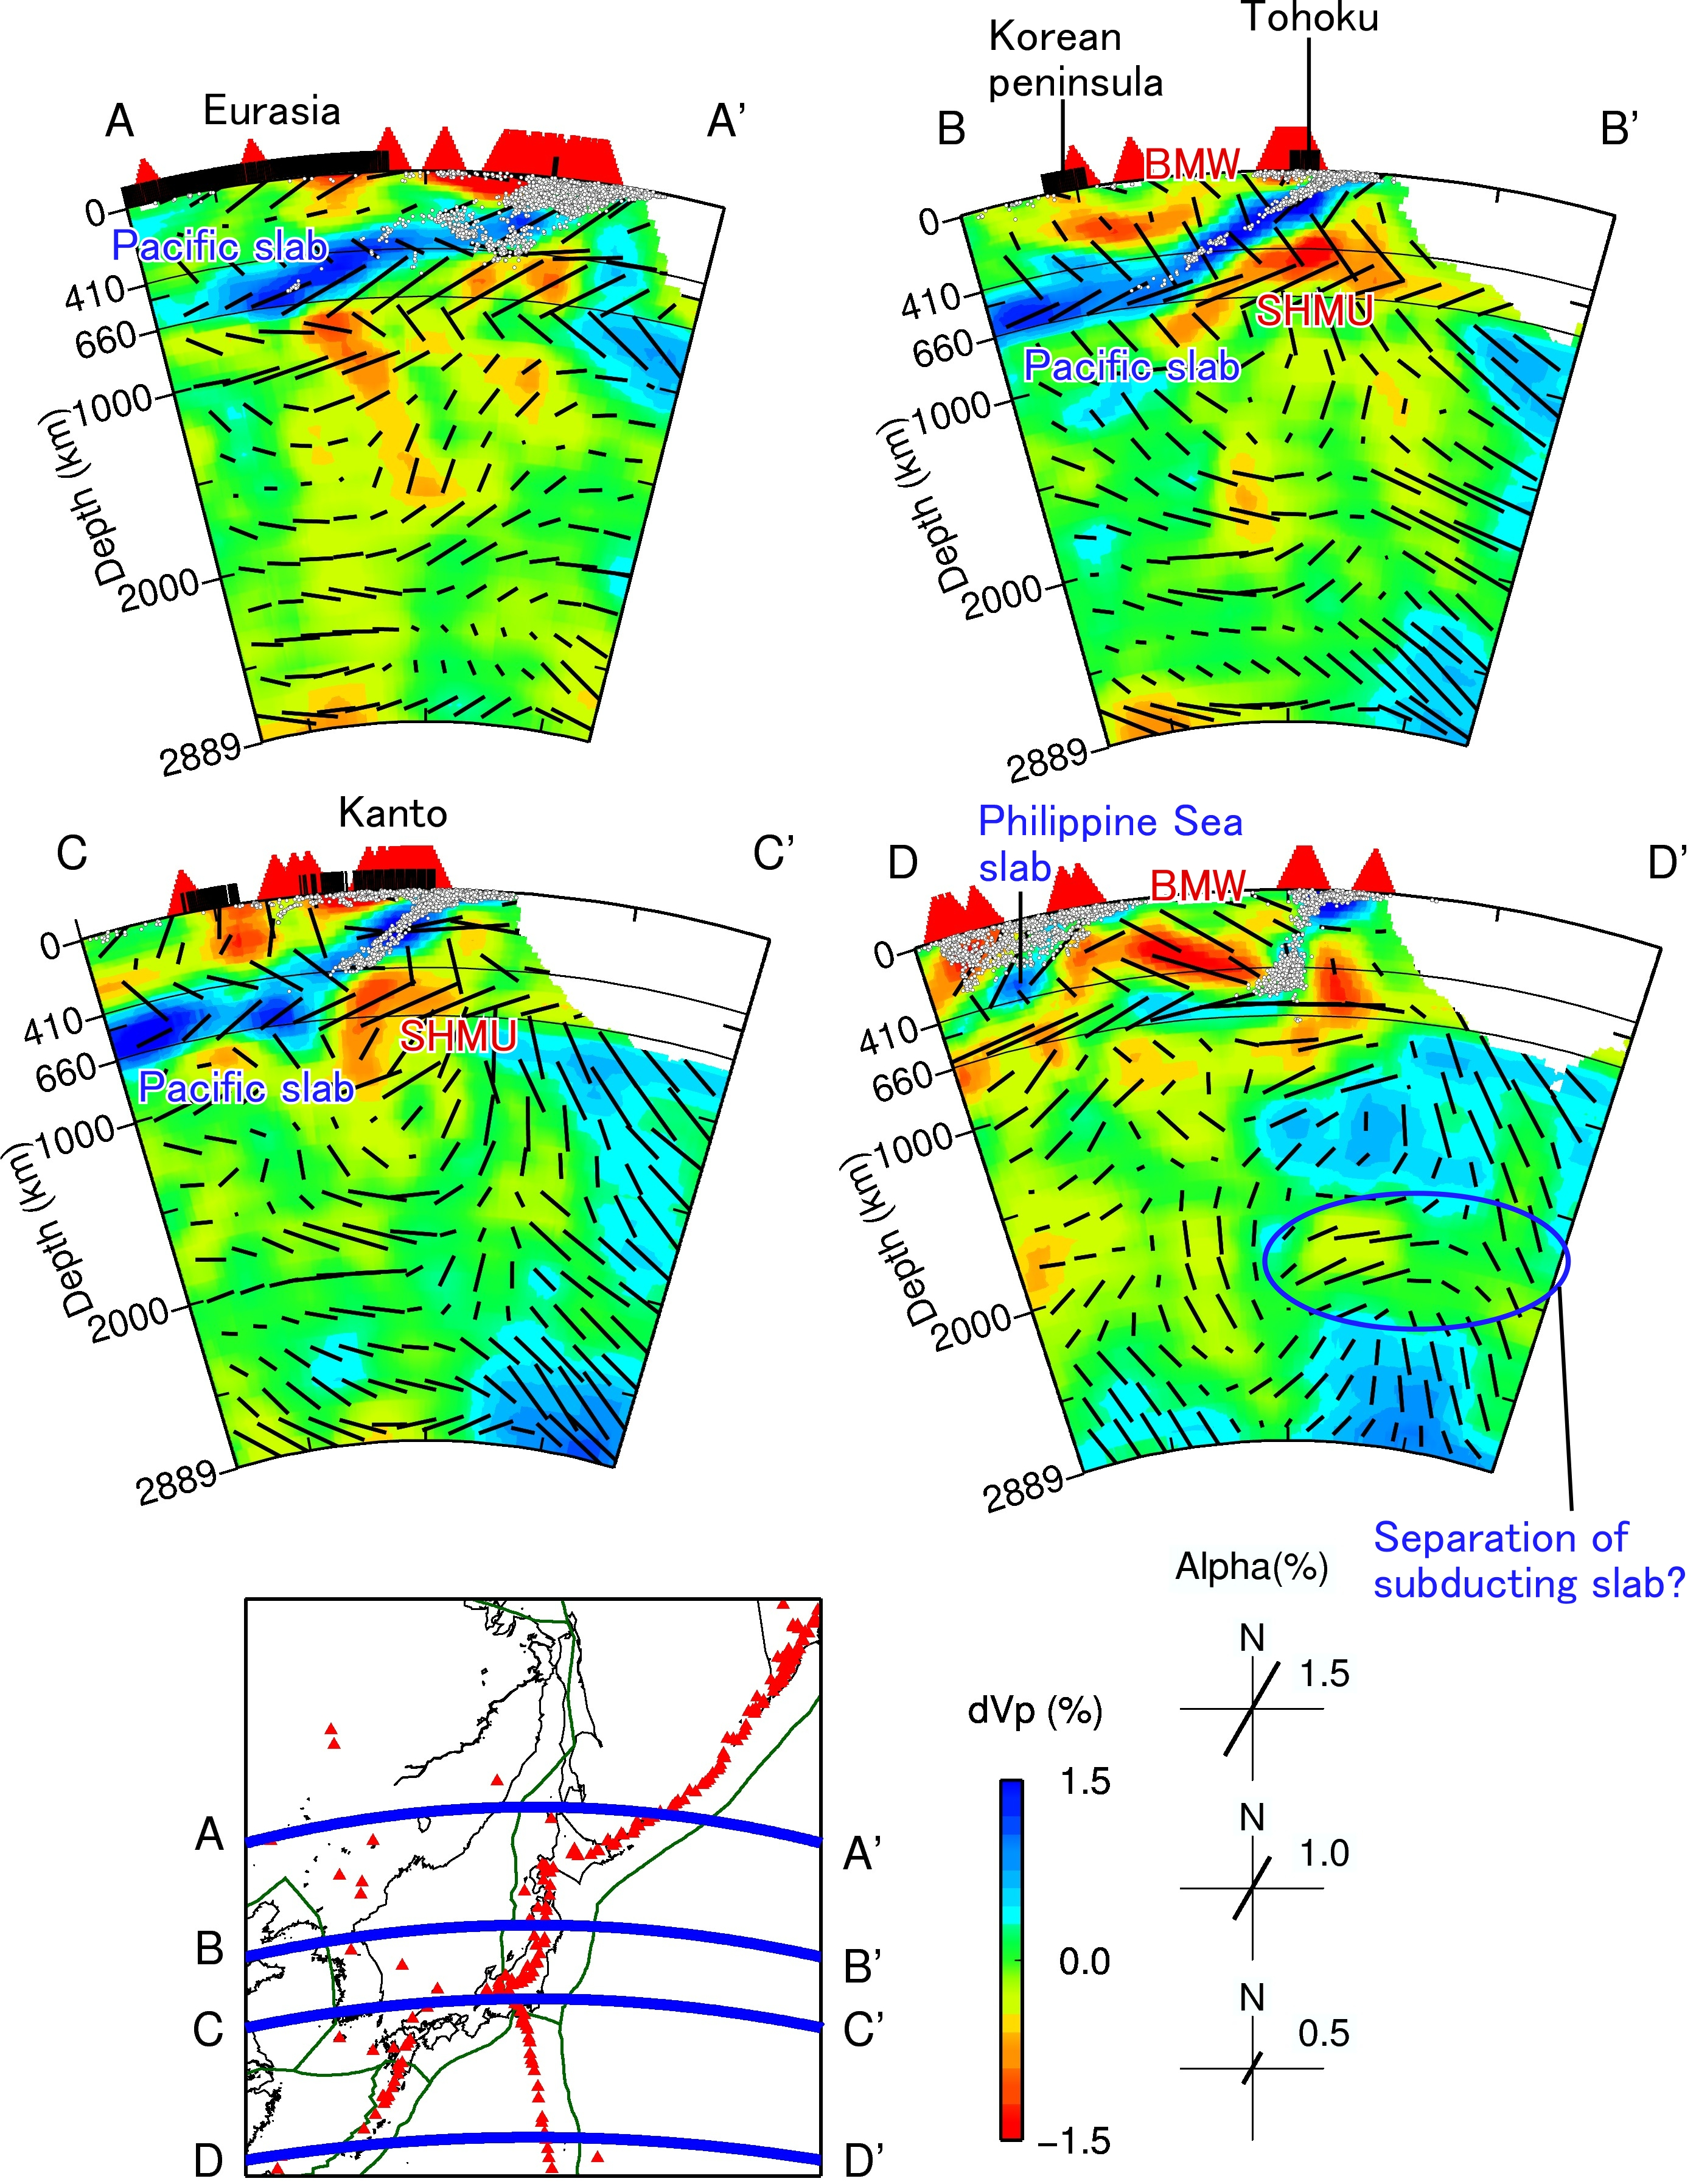
Figure 4.Vertical cross-sections of anisotropic tomography along four E-W profiles as shown on the inset map(Toyokuni et al., 2025). The blue and red colors denote high and low isotropic P-wave velocities, respectively, whose scale (in %) is shown at the bottom right. The length of black bars denotes the anisotropic amplitude, whose scale (in %) is also shown at the bottom. The bar orientation denotes fast velocity direction (FVD): vertical bars denote N-S FVDs, whereas horizontal bars denote E-W FVDs. The thick black lines on the surface denote land areas. Active volcanoes within a ±2° width and local seismicity within a ±1° width of each profile are shown as red triangles and white circles, respectively. SHUM (sub-slab hot mantle upwelling) represents one possible interpretation of sub-slab low-velocity anomaly (SLVA).